
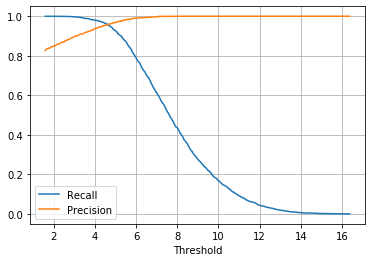
Choosing the threshold to use for classification depends on many parameters. Here, we are going to use a threshold that leads to the best trade-off between precision and recall:
precisions, recalls, thresholds = precision_recall_curve(y_train, X_train.score)
plt.plot(thresholds, recalls[:-1], label="Recall")
plt.plot(thresholds, precisions[:-1], label="Precision")
plt.legend()
plt.grid()
plt.xlabel("Threshold")
plt.show()
The generated plot is reproduced here, where the decreasing curve shows the recall and the increasing curve represents the precision:
Choosing a threshold of 5 leads to the following confusion matrix:
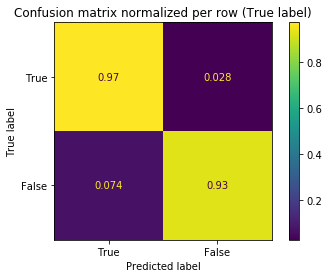
Among all existing edges at time t2 (first row), 97% were correctly labeled as True by our algorithm. Similarly, for the non-existing edges, 93% were correctly classified as False.