Facebook, LinkedIn, and all of our favorite social networks use graphs to model their users and interactions. In the most basic example of a social graph, nodes represent people, and edges the friendship or professional relationship between them, as illustrated in the following image:
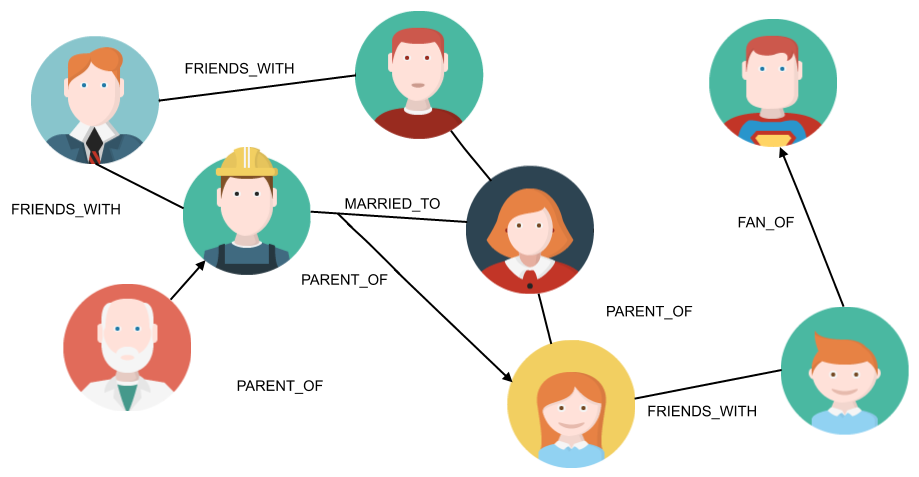
Here again, graphs allow us to see the data from a different perspective. For instance, we have seen this kind of information when looking at someone’s profile on LinkedIn:
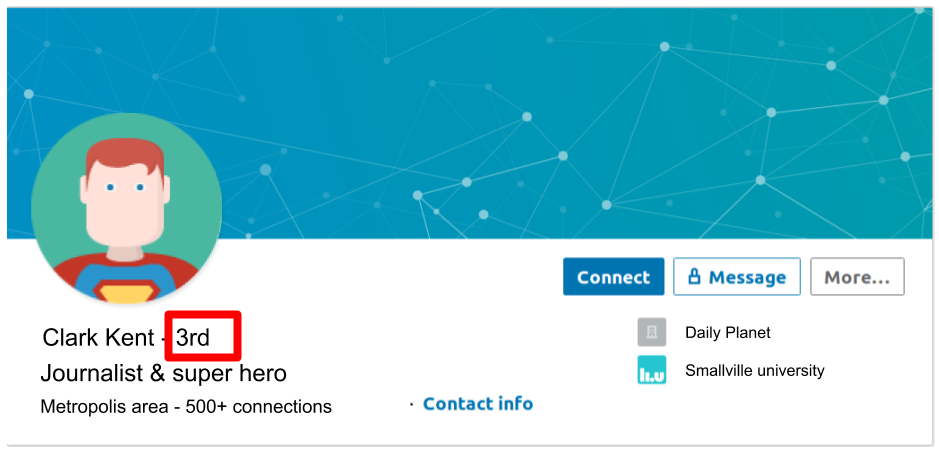
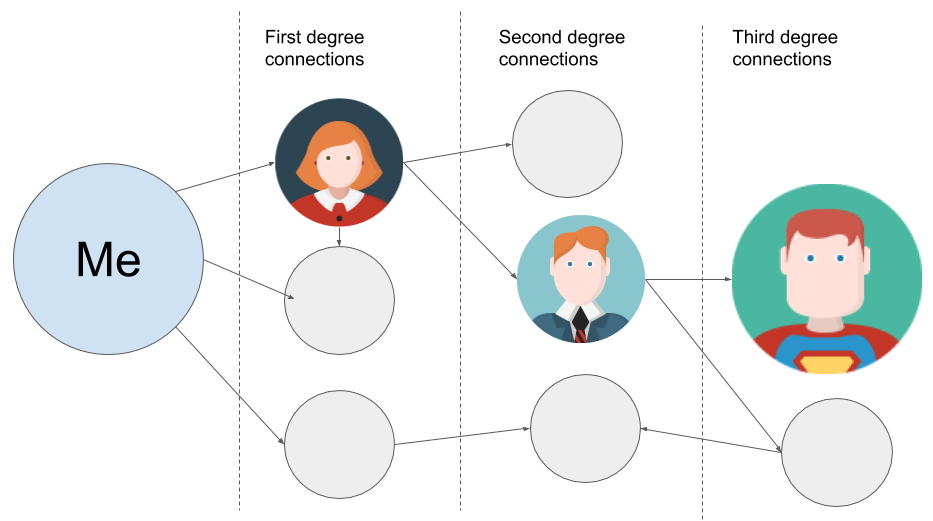
In that case, it tells us that the connected user (me) is just two connections away from Clark Kent. In other words, one person in my network is already connected to a person who is connected to Clark Kent. The following image illustrates this more clearly, in terms of degrees of separation:
You've probably heard about the Six Degrees of Separation theory. In 1929, the Hungarian journalist Frigyes Karinthy proposed a theory according to which each person on Earth is at most six connections away from any other person. In other words, if you want to talk to one person, say Barack Obama, a friend of yours has a friend whose friend has a friend... who knows Barack Obama and can introduce you to him. According to Karinthy, this connection chain must contain less than six connections, or seven people in total, including you and Barack Obama.
Given that there are more than 7 billion human beings on Earth, that's a surprisingly small number! With the large databases that are available nowadays, such as the friendship connections from Facebook or email exchanges from Microsoft, researchers have tried to prove the preceding statement. From the Microsoft email database, for instance, it was shown in 2008 that the average degree of separation between 180 billion distinct pairs of people was around 6.6. But this is just an average, and the number of hops to connect two people could go up to 29 with that dataset.
Many other kinds of analyses can be performed over social graphs:
- Node importance: Again, it might be very useful to have an idea of which nodes (persons) are the most important. However, the definition of importance here will be different than in the case of a computer network, since it is very unlikely that a single person's retirement from social media makes the whole world collapse. However, influencers have a particular interest for marketing experts.
- Community detection: Also called clustering, is a way to find a group of nodes sharing some characteristics. For instance, finding users who share the same interests, or visit the same places, can be used to recommend products to them.
- Link prediction: With a graph, you can think of creating intelligent models to predict whether two entities are likely to be connected in the future. Here again, recommendation engines are one possible application of such a tool.
As you can see, networks of all kinds are very well suited to graph databases. But we can go far beyond that view and imagine all kinds of data as a graph, which will open up a lot of new perspectives.