The previous exercise probably looks easy to you, because you have followed lectures or tutorials about SQL and use it pretty often in your daily work. But let's be honest, the first time you face a problem and have to create the data model that will allow you to solve it, you will probably draw something that looks like the diagram in the following image, right?
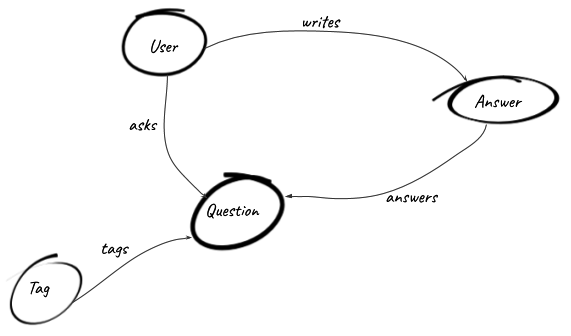
This is one of the powers of graph databases:
Neo4j, as a graph database, allows you to create vertices, or nodes, and the relationships connecting them. The next section summarizes how the different entities in the Neo4j ecosystem are related to each other and how we can structure our data in a graph.
The whiteboard model is your data model.