


CONSTANT, AVERAGE, AND REFERENCE LINES
To show a certain threshold value, a benchmark, or a ceiling in your visualization, you drag the item Constant Line onto the view. You will be able to choose the value of the constant, as shown in Figure 7.1.
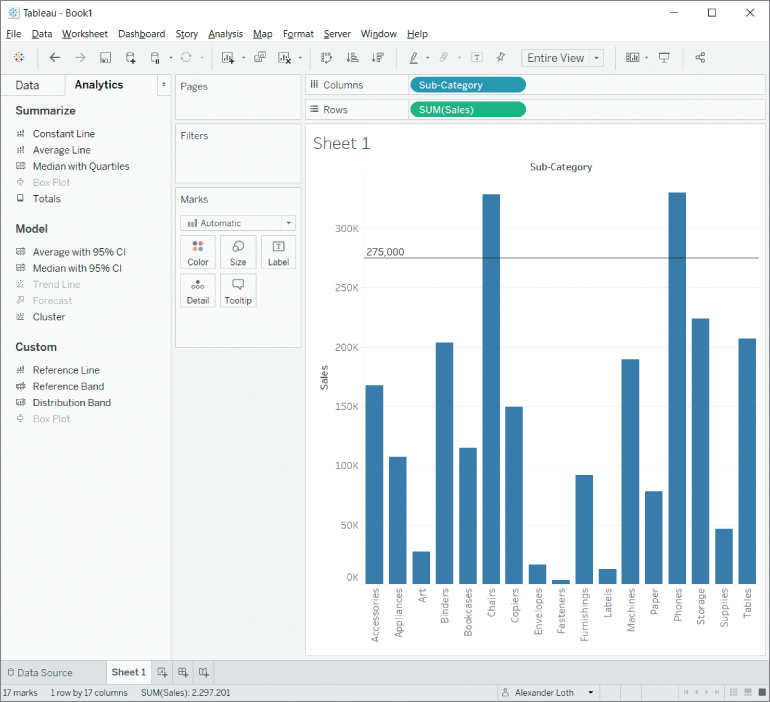
Figure 7.1 Bar chart with a constant line.
Average Line, on the other hand, will add a line determined by the arithmetic mean of all the marks in the chosen partition (for the whole table, for each individual pane, or for each cell, as defined by the dimensions in the view). And the Reference Line tool will let you add a line whose position is determined by another measure, a calculated field, or a parameter.


