


THE TABLEAU WORKSPACE
Now that you have connected to a data source and opened your first worksheet, it's time to become familiar with the Tableau interface. Figure 1.9 shows 15 numbered portions of the interface. The still‐blank canvas (1), as it is called, includes the title Sheet 1 (2). On the left, you will find the Data pane (3) (more on that in the section “The Data Pane”). The tab next to it opens the Analytics pane (see Chapter 7 for more details).
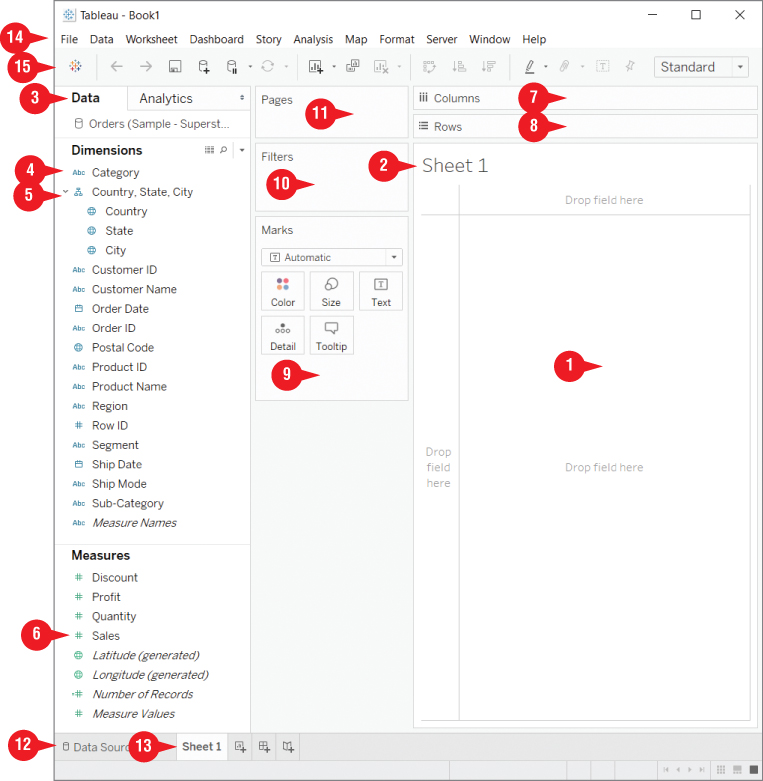
Figure 1.9 The Tableau workspace with a yet‐to‐be‐filled canvas.
In Tableau, most interactions are achieved by dragging and dropping items onto the canvas. This makes interacting with Tableau easy and intuitive. Both dimensions (4) (including hierarchical dimensions [5]) and measures (6) can be moved directly onto it. Alternatively, they can be placed on the Columns (7) and Rows (8) shelves, in order to add them to your visualization.
Fields from the Data pane can also be placed onto...


