


DENSITY MAPS
A density map, or heatmap, groups occurrences of a dimension that are geographically close to each other and colors the area in a more intense tone than areas with more sparse distributions.
To demonstrate this, return to the symbol map of US cities from earlier, but remove the Sales and Profit measures from the view. (If you prefer to start with a blank canvas, simply double‐click City, State, and Country to get the same result.) You get a simple dot map that shows in which cities you have customers. Some regions, such as the San Francisco Bay Area, for example, have high concentrations of dots. Because of the overlapping dots, it is difficult to spot any spatial patterns. This issue is sometimes referred to as over‐plotting.
Change the mark type in the Marks card to Density, and you can see that the concentration is actually much higher in Southern California compared to further north in the Bay Area. See Figure 6.4.
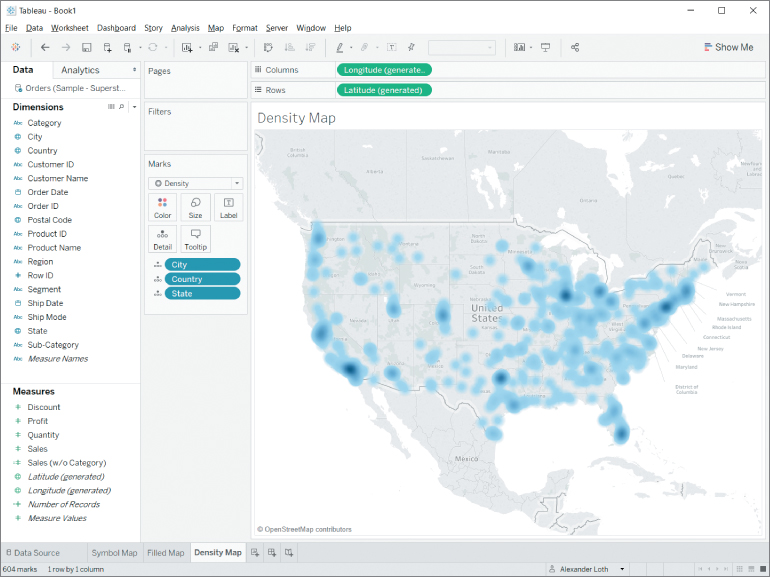
Figure 6.4 Density map.


