WORKING WITH MARKS
After the Rows and Columns shelves, the next‐most‐important area is the Marks card with its various symbols. You can add dimensions and measures here, too, to further style your chart.
Among other things, you can control the color, size, form, and labeling of the marks displayed in your visualization.
Working with Color
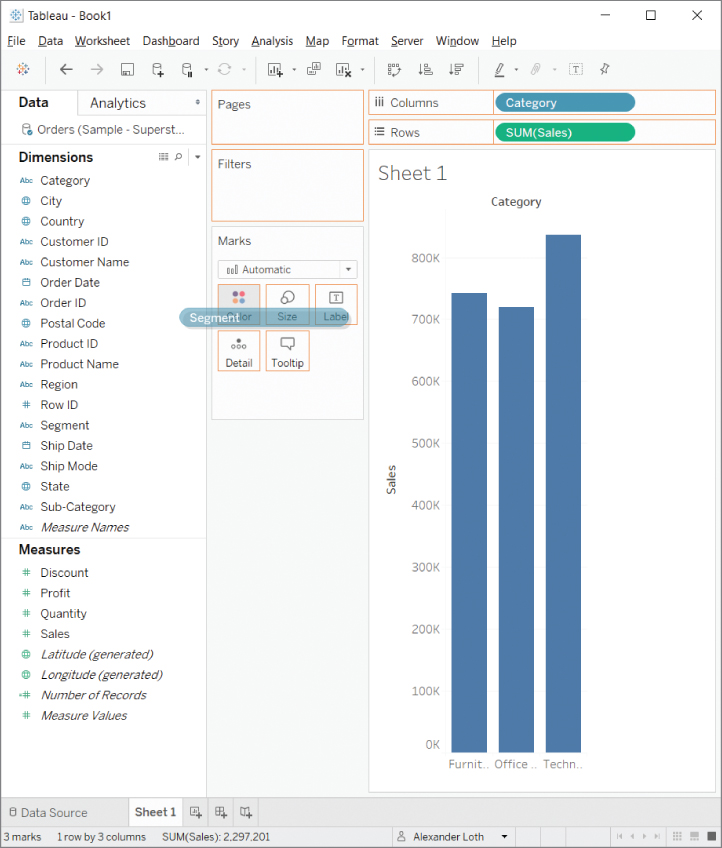
Probably the most‐used feature of the Marks card is the Color field. To try this out, drag the Segment dimension onto Color, as demonstrated in Figure 1.12.

Figure 1.12 Dragging the Segment dimension onto Color.
Adding More Information to Tooltips
A tooltip is a little hover box that displays additional information when you point at individual...


