
What information do we have so far? For the test sample, our graph at time t2, we know the following for each pair of nodes:
- Whether there actually is a link between them at time t2 (the ground truth)
- The score computed from the link prediction metric
From this information, we can draw the distribution of scores for each label. Let's consider the following plot:
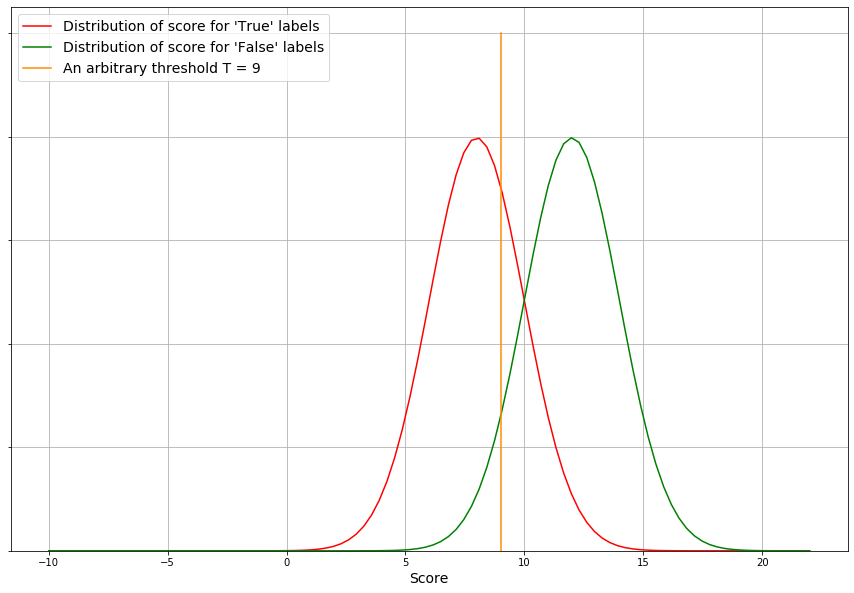
The left-most curve represents the distribution of scores for all observations that have the label False, while the right-most curve corresponds to the distribution of scores for all observations that have the label True. To assess the quality of the metric, we can use an ROC curve.
To make predictions out of this information, we need to define a score threshold. To define a score threshold, we need to set a vertical line so that all observations on the left of this line will be classified as False and all observations on the right (that is, the observations having a score higher than...