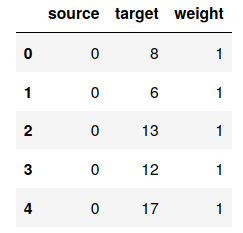
The first rows of the DataFrame we have just created are reproduced in the following diagram:

We can use this to create the networkx graph using the following function:
import networkx as nx

G = nx.from_pandas_edgelist(data)
The name of the columns used as source and target are configurable. In the preceding code, I have used the default values, but I could have written the following command:
G = nx.from_pandas_edgelist(data, source="source", target="target")
Now that we have our graph object, we can run algorithms on it, for instance, node embedding.


