Search icon CANCEL
Subscription
0
Cart icon
Your Cart (0 item)
Close icon
You have no products in your basket yet
Save more on your purchases! discount-offer-chevron-icon
Savings automatically calculated. No voucher code required.
Arrow left icon
All Products
Best Sellers
New Releases
Books
Videos
Audiobooks
Learning Hub
Newsletter Hub
Free Learning
Arrow right icon
timer SALE ENDS IN
0 Days
:
00 Hours
:
00 Minutes
:
00 Seconds
Arrow up icon
GO TO TOP
Hands-On Graph Analytics with Neo4j

You're reading from   Hands-On Graph Analytics with Neo4j Perform graph processing and visualization techniques using connected data across your enterprise

Arrow left icon
Product type Paperback
Published in Aug 2020
Publisher Packt
ISBN-13 9781839212611
Length 510 pages
Edition 1st Edition
Languages
Tools
Arrow right icon
Author (1):
Arrow left icon
 Scifo Scifo
Author Profile Icon Scifo
Scifo
Arrow right icon
View More author details
Toc

Table of Contents (18) Chapters Close

Preface 1. Section 1: Graph Modeling with Neo4j
2. Graph Databases FREE CHAPTER 3. The Cypher Query Language 4. Empowering Your Business with Pure Cypher 5. Section 2: Graph Algorithms
6. The Graph Data Science Library and Path Finding 7. Spatial Data 8. Node Importance 9. Community Detection and Similarity Measures 10. Section 3: Machine Learning on Graphs
11. Using Graph-based Features in Machine Learning 12. Predicting Relationships 13. Graph Embedding - from Graphs to Matrices 14. Section 4: Neo4j for Production
15. Using Neo4j in Your Web Application 16. Neo4j at Scale 17. Other Books You May Enjoy

Embedding specifications

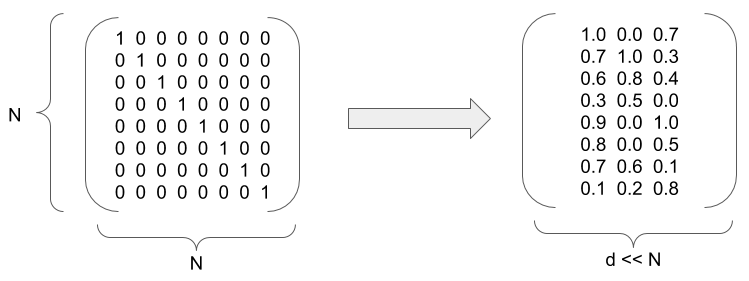
The goal of embedding is to encode words as a vector V(word) with dimension d « N, such that the word meaning is somehow preserved. So, starting with the one-hot encoded matrix representing words, we want to end up with a matrix with size N×d, where d is small, as illustrated in the following diagram:

However, so far, all we have done is reduce the number of features. What it actually means to preserve the word meaning is illustrated by the following diagram:

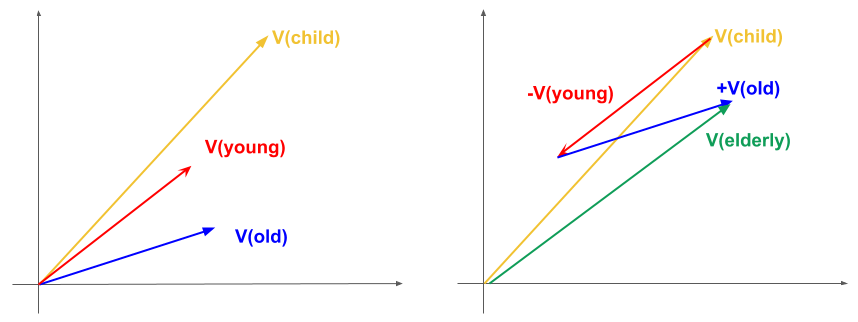
This diagram shows four words – child, young, old, and elderly, each represented by two-dimensional vectors. These vectors are related to each other as in the following equation:

V(child) - V(young) + V(old) ≈ V(elderly)

This means that if you take the vector representing the word child and remove from it the vector representing the word young, you have an intermediate vector representing a person without age. If you add to this vector the vector representation of the word...

lock icon The rest of the chapter is locked
Register for a free Packt account to unlock a world of extra content!
A free Packt account unlocks extra newsletters, articles, discounted offers, and much more. Start advancing your knowledge today.
Unlock this book and the full library FREE for 7 days
Get unlimited access to 7000+ expert-authored eBooks and videos courses covering every tech area you can think of
Renews at £13.99/month. Cancel anytime
Visually different images