
Working with tables
In this exercise, you will work with the table object that you will create on a canvas page and will go through the grid later in this chapter. Execute the following steps to create a table on your story page to evaluate this object:
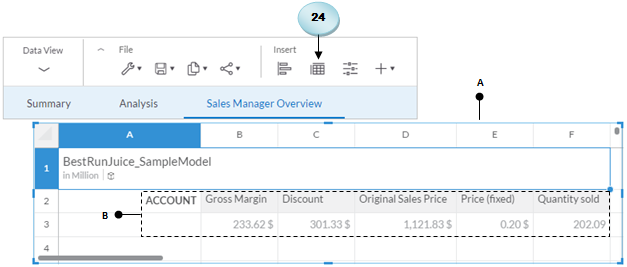
- Click on the table icon on the
Inserttoolbar. A table object (A) will be added, populated with all the members from theAccountdimension (B) in theBestRunmodel:
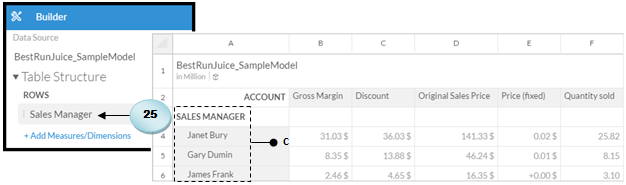
- In the
Builderpanel, click on theAdd Measure/Dimensionslink in theRowssection, and select theSales Managerdimension. The table will be refreshed to show values from the selected dimension in the first table column (C). Also note that all the five measures are updated as well to show the corresponding values for each sales manager:
- Under the
Columnssection, click on theAdd Measures/Dimensionslink, and select theDatedimension. Once again, the table will be refreshed to show all the members of the selected dimension under every measure. For example,Gross Marginwill show...