
Creating a blended table
A blended table is a table in which data is displayed from different models. You have already seen the use of linked dimensions to display data from multiple models in a single chart. Here, you will create a blended table to browse data from two models using the same linked dimension you created in Chapter 6, Analyzing Data Using Geomaps and Other Objects.
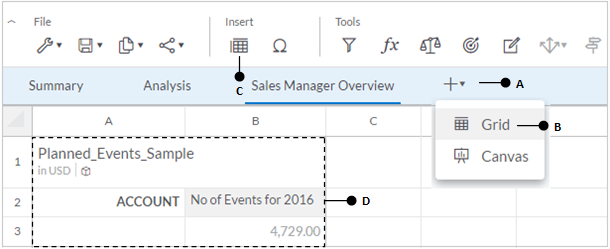
- Click on the Add Page icon (A), and select
Grid(B) to add a new grid page to the story. In the new grid page, click on the Add icon (C) to add a table to the grid. In theSelect Modeldialog box, select the existingPlanned_Eventsmodel, and click onOK. A table (D) will be added to the grid containing theAccountdimension (No of Events for 2016) from thePlanned_Eventsmodel:
- In the
Builderpanel, click on the linkAdd Measures/Dimensionsin theRowssection, and selectCityfrom the list of dimensions. Click on the sameAdd Measures/Dimensionslink, and selectEventas the second dimension. The table will take...