
Apply conditional formatting using thresholds
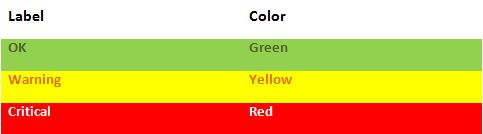
In this exercise, you will add thresholds to the Numeric Point chart. Thresholds are used to provide visual cues for your information. By defining thresholds on your objects you can see at a glance what areas are performing well, and what areas need improvements. By default, you get three default ranges with the following labels and colors. However, you can use as many or as few ranges as you like, and you can change the label names and colors, too:
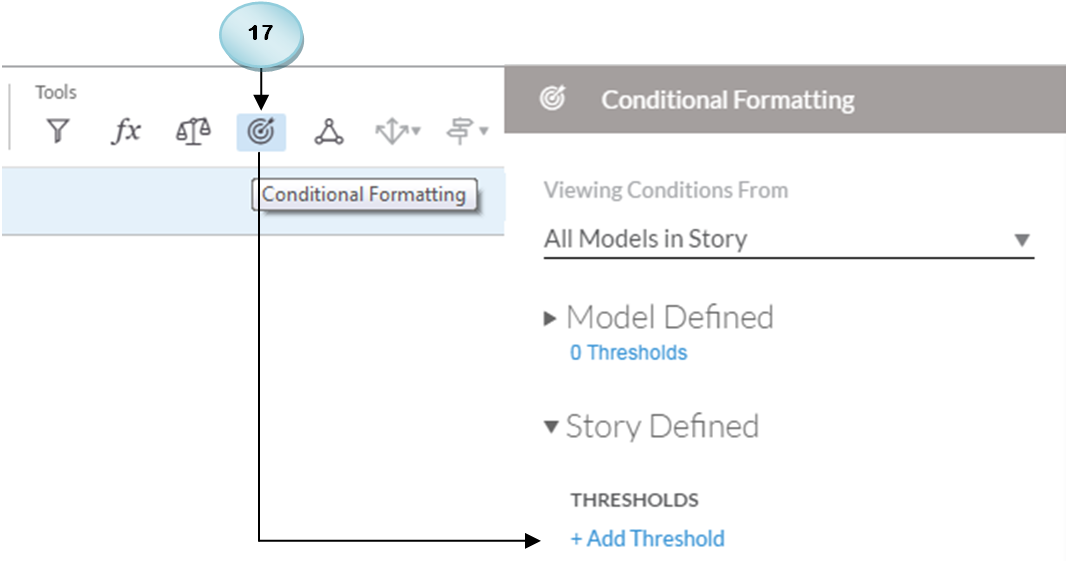
- From the
Toolssection in the toolbar, click the Conditional Formatting icon. Then, click theAdd Thresholdlink in theConditional Formattingpanel to your right. Using theConditional Formattingfeature, you can add thresholds and assign colors to highlight information, such as low sales in an area:
- Ensure that the
BestRunmodel is selected in theModelsection. If not, select the model from the drop-down list. Next, select the calculated measureNet Revenuefrom theMeasurelist.
The initial view...