
Using KPIs in a table
Key performance indicators (KPIs) indicate the status of a measure based on user-defined thresholds. You have already gone through some instances of KPI in previous chapters. Here, you will learn how to apply this success metric to a table. In this exercise, you will create a KPI to analyze the net revenue for 2016. First, you will define the KPI for a single cell in the table, and then you will apply the same KPI to a range of selected cells. Here's the procedure:
- Click on the first record's cell in the
Net Revenuecolumn to select it. - Click on the more actions icon.
- Select the first option,
Set KPI, from the more actions menu. - In the
KPIpanel, which appears on the right side, click on theAdd KPIlink:
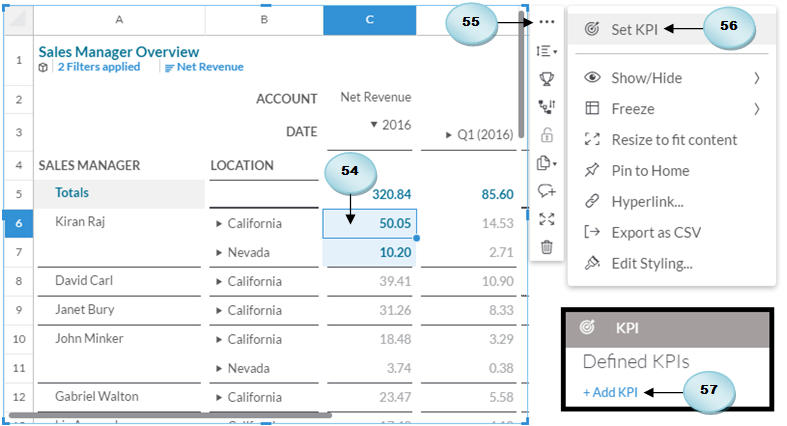
- In the
Define KPIswindow, enterNet Revenue 2016for the KPI name, and create the three thresholds (OK, Warning, and Critical) along with respective values, as illustrated in the following screenshot. Use the+icon (A) to add additional thresholds. Once you are done,...