Anatomy of SAP Analytics Cloud
Models are the basis for all of your analysis in SAP Analytics Cloud. You can create planning and analytics models based on the cloud or on-premise data sources. Besides creating a simple analytics model, business analysts and finance professionals can quickly and easily build connected planning models to analyze data and then collaborate with each other to attain better business performance. After creating these models, you can share it with other users in your organization. Before sharing, you can set up model access privileges for users according to their level of authorization and can also enable data auditing. With the help of SAP Analytics Cloud's analytical capabilities, users can discover hidden traits in the data and can predict likely outcomes. It equips them with the ability to uncover potential risks and hidden opportunities.
Once you have created a model and set up appropriate security for it, you can create stories in which the underlying model data can be explored and visualized with the help of different types of charts, geo maps, and tables. There is a wide range of charts you can add to your story pages to address different scenarios. The intelligent charting feature of SAP Analytics Cloud proposes the ideal chart type based on data relationships. On your story pages, you can link dimensions to present data from multiple sources. Adding reference lines and thresholds, applying filters, and drilling down into data can be done on the fly. The ability to interactively drag and drop page objects is the most useful feature of this application.
The collaboration, alert, and notification features of SAP Analytics Cloud keep business users in touch with each other while executing their tasks.
In the past, board meetings were held in which the participants used to deliver their reports through their laptops and a bunch of papers. With different versions of reality, it was very difficult for decision makers to arrive at a good decision. With the advent of the SAP digital boardroom, board meetings have been revolutionized. It is a next-generation presentation platform, which helps you visualize your data and plan ahead in a real-time environment. It runs on multiple screens simultaneously, displaying information from different sources. Due to this capability, more people can work together using a single dataset that consequently creates one version of reality to make the best decision.
With the help of the administration and security features of the application, you can create users and set up teams, create new roles with different system access privileges and assign them to users, monitor the application usage, and use export and import utilities to deploy application content.
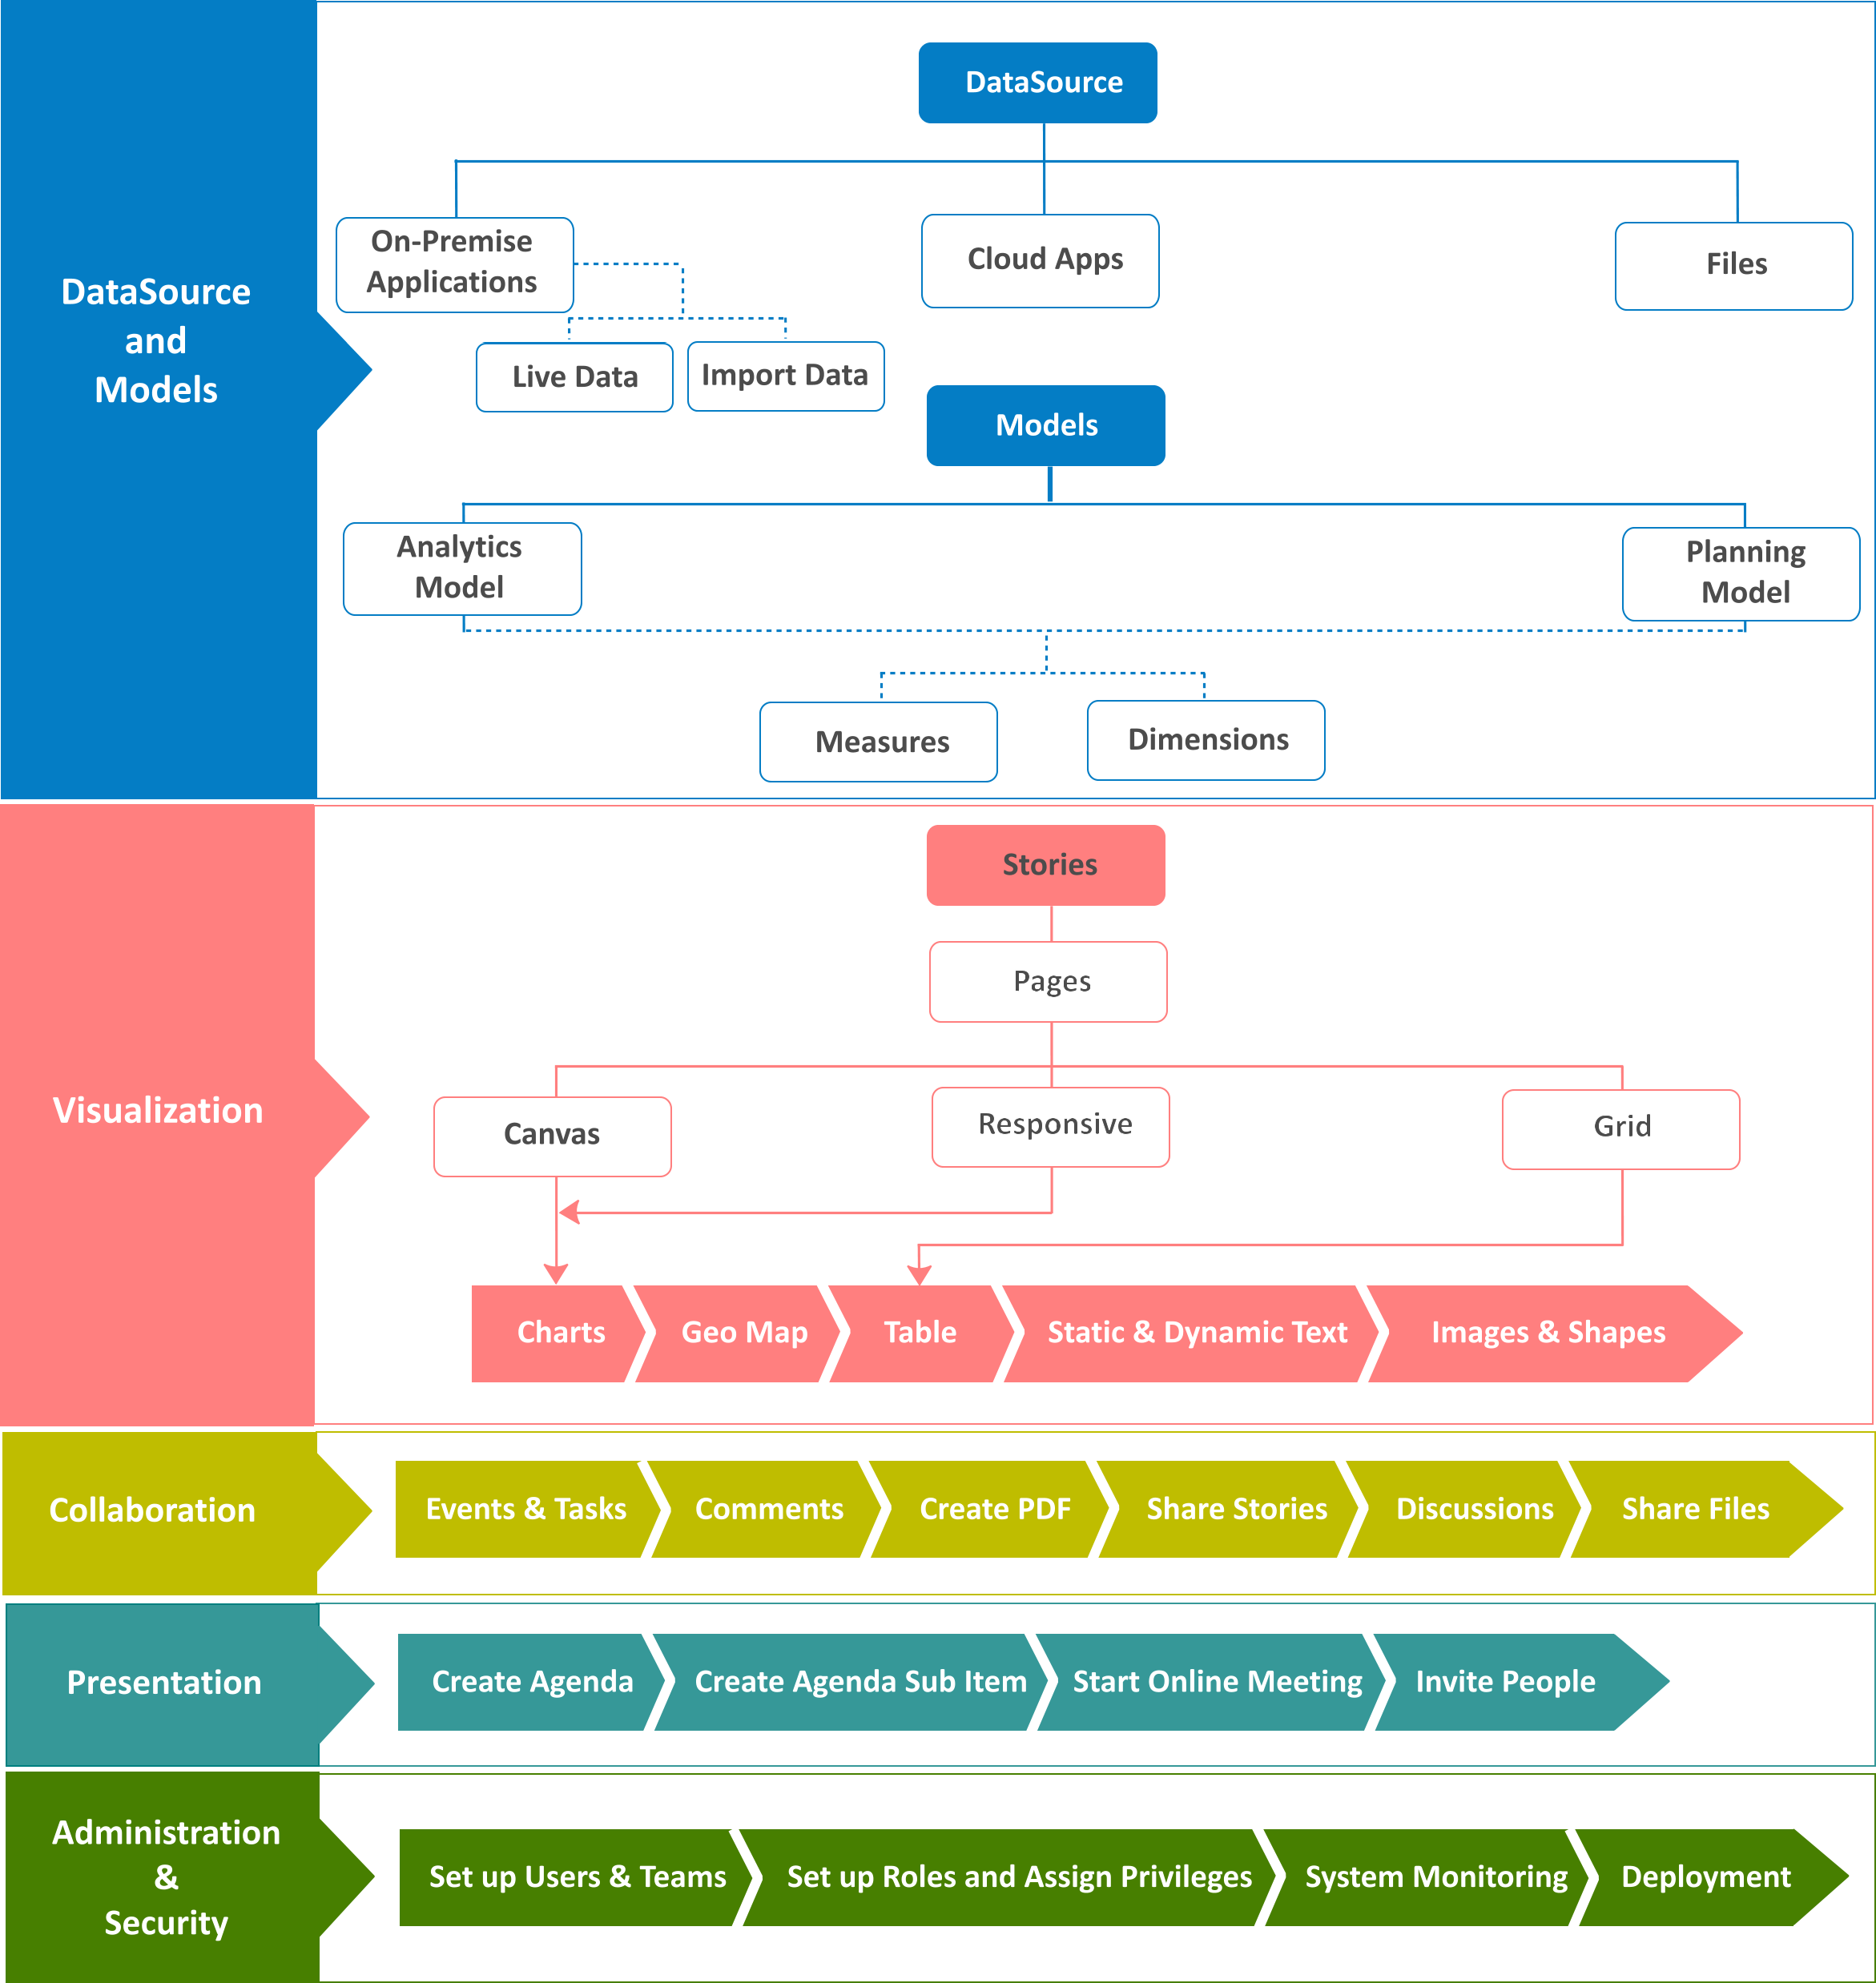
The following figure depicts the anatomy of SAP Analytics Cloud:
The Home screen
When you successfully log in to SAP Analytics Cloud, you are greeted with the Home screen. Note that the Home screen is private to every SAP Analytics Cloud user, so it can't be shared. Here are a few pointers to help you get acclimatized to the Home screen:
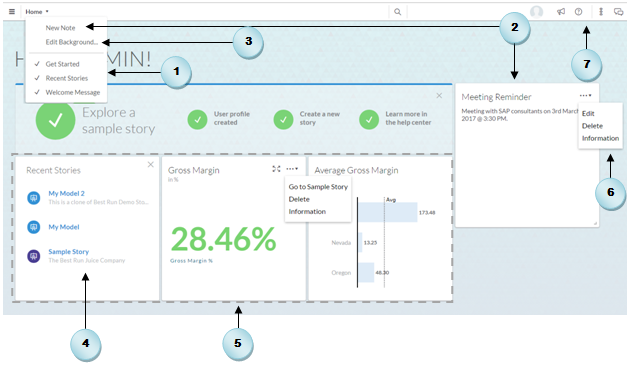
- To remove the
Get Startedwidget, theRecent Storiestile, or theWelcomemessage, go to theHomemenu, and deselect the item you want to remove. - The
Homescreen also allows you to add useful reminders for upcoming events and personal notes. - Using the
Edit Backgroundoption, you can customize the display background and add a logo to theHomescreen. - The first tile titled
Recent Storieslists the five most recent stories you have accessed. - Your recent stories and visualizations are displayed as tiles. You can pin additional tiles from your stories to the
Homescreen. - Click the ellipsis icon to modify or delete a note.
- The toolbar appears on top of every screen. Using the icons on the toolbar, users can see their own profiles, view notifications, get online help, view the time panel, and collaborate.
The main menu
The following screenshot and bullets will help you understand the main menu better:
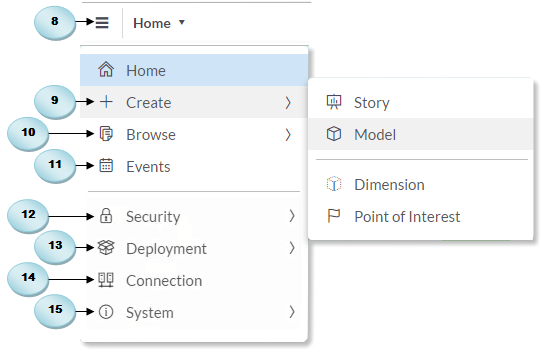
- The main menu icon is your gateway to SAP Analytics Cloud. It provides you with all the options to get things done.
- Click on
Createto add newStories,Models,Process,Dimension,Currency, andPoint of Interest. Models are discussed in Chapter 2, Models in SAP Analytics Cloud, and Chapter 3, Planning Model, whereas you will create stories in Chapters 4 to 7. The Allocation option under the Process sub-menu is discussed in Chapter 3, Planning Model. - Select
Browseto access existingStories,Models,Dimensions,Currencies,Point of Interest, andFiles. Files are discussed in Chapter 8, Collaboration. - The
Eventsoption opens theEventspage, where you can manage your planning and analytic activities and assign tasks to other users. This subject is discussed in Chapter 8, Collaboration. - The options provided in the
Securitymenu items lets you create and manage application users, teams, roles, requests, and monitor data changes and user activities. These options are discussed in Chapter 10, System Administration. - Deployment includes creation and management of export and import of application content. This subject is discussed in Chapter 10, System Administration.
- Using the
Connectionsmenu item, you can create and maintain connections to remote systems. You can create connections to import data into SAP Analytics Cloud or create live data connections to SAP HANA. You will see some instances of establishing connections later in this chapter. - The
Systemmenu item includes theMonitor,Administration, andEnabling SAMLSingle Sign-On (SSO) options. Using these options, the system administrator monitors the system, reads system events and errors in the system log, and sets up SAML Single Sign-On (SSO) to work with SAP Analytics Cloud.
Note
Due to the frequent updates SAP makes to the application, the screenshots provided in this book might differ from yours.