Search icon CANCEL
Subscription
0
Cart icon
Your Cart (0 item)
Close icon
You have no products in your basket yet
Save more on your purchases! discount-offer-chevron-icon
Savings automatically calculated. No voucher code required.
Arrow left icon
All Products
Best Sellers
New Releases
Books
Videos
Audiobooks
Learning Hub
Newsletter Hub
Free Learning
Arrow right icon
timer SALE ENDS IN
0 Days
:
00 Hours
:
00 Minutes
:
00 Seconds
Arrow up icon
GO TO TOP
Visual Analytics with Tableau

You're reading from   Visual Analytics with Tableau A four-color journey through a complete Tableau visualization

Arrow left icon
Product type Paperback
Published in May 2017
Publisher Wiley
ISBN-13 9781119560203
Length 288 pages
Edition 1st Edition
Tools
Arrow right icon
Author (1):
Arrow left icon
Alexander Loth Alexander Loth
Author Profile Icon Alexander Loth
Alexander Loth
Arrow right icon
View More author details
Toc

Table of Contents (16) Chapters Close

1. Cover FREE CHAPTER
2. Foreword by Nate Vogel
3. Foreword by Sophie Sparkes
4. Introduction 5. Chapter 1: Introduction and Getting Started with Tableau 6. Chapter 2: Adding Data Sources in Tableau 7. Chapter 3: Creating Data Visualizations 8. Chapter 4: Aggregate Functions, Calculated Fields, and Parameters 9. Chapter 5: Table Calculations and Level of Detail Calculations 10. Chapter 6: Maps 11. Chapter 7: Advanced Analytics: Trends, Forecasts, Clusters, and other Statistical Tools 12. Chapter 8: Interactive Dashboards 13. Chapter 9: Sharing Insights with Colleagues and the World 14. Chapter 10: Data Preparation with Tableau Prep 15. Index
16. End User License Agreement

NAVIGATION BUTTONS

By including navigation buttons, you allow end users to jump from one dashboard to another.

From among the dashboard objects, find the Button item, and drag it onto your dashboard. You may have to resize the button with the mouse. In Figure 8.7, the navigation control has been placed above the color legend.

Screenshot of the dashboard with a navigation button, with menus such as File, Data, Worksheet, Dashboard, Story, Analysis, Map, Format, Server, Window, and Help.

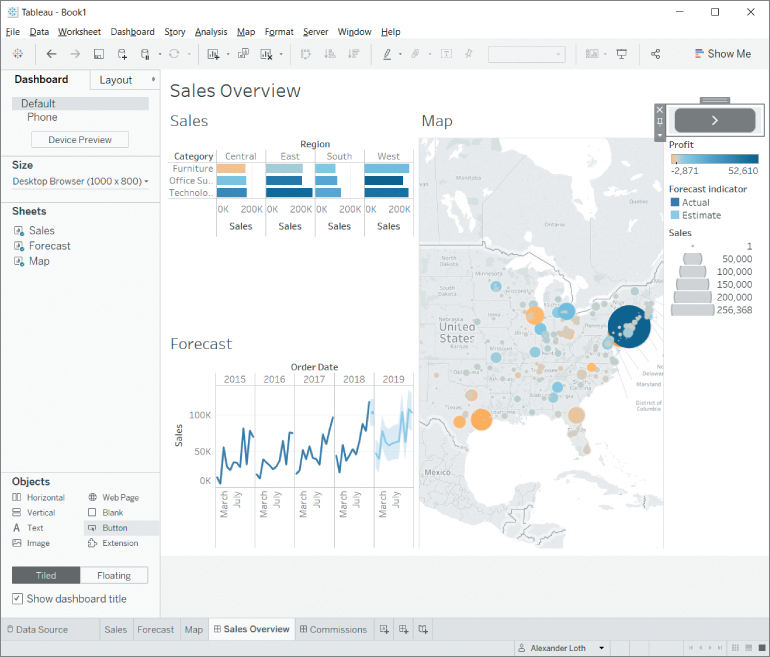
Figure 8.7 The dashboard with a navigation button.

After placing the button, open its context menu and choose Edit Button. Select the target sheet in the Navigate To drop‐down menu (Figure 8.8). This can be a dashboard, a worksheet, or a Story.

Screenshot of Edit Button dialog box, with options such as Navigate to, Image, Tooltip.

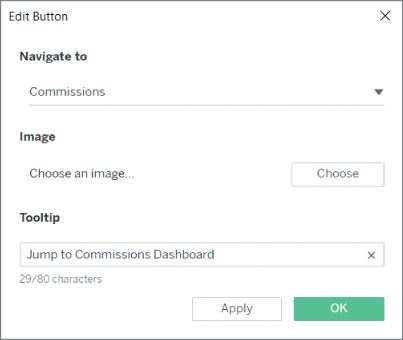
Figure 8.8 Edit Button dialog box.

Optionally, you can change the image used for the button or edit the tooltip text, which tells the user what the button does when they hover over it.

lock icon The rest of the chapter is locked
Register for a free Packt account to unlock a world of extra content!
A free Packt account unlocks extra newsletters, articles, discounted offers, and much more. Start advancing your knowledge today.
Unlock this book and the full library FREE for 7 days
Get unlimited access to 7000+ expert-authored eBooks and videos courses covering every tech area you can think of
Renews at £13.99/month. Cancel anytime
Visually different images