


WORKING WITH MEASURES AND DIMENSIONS
Now that you are familiar with the Tableau interface and know where to find measures and dimensions in the Data pane, you can finally get started with your first data visualization!
Visualizing a First Measure
Often it makes sense to start a visualization by adding a measure to the view. In the Superstore workbook, sales revenue is a good candidate.
To do this, drag the Sales measure onto the left side of the canvas, to the vertical area labeled Drop Field Here. As you can see in Figure 1.10, the area will be highlighted in green when you move a measure there.
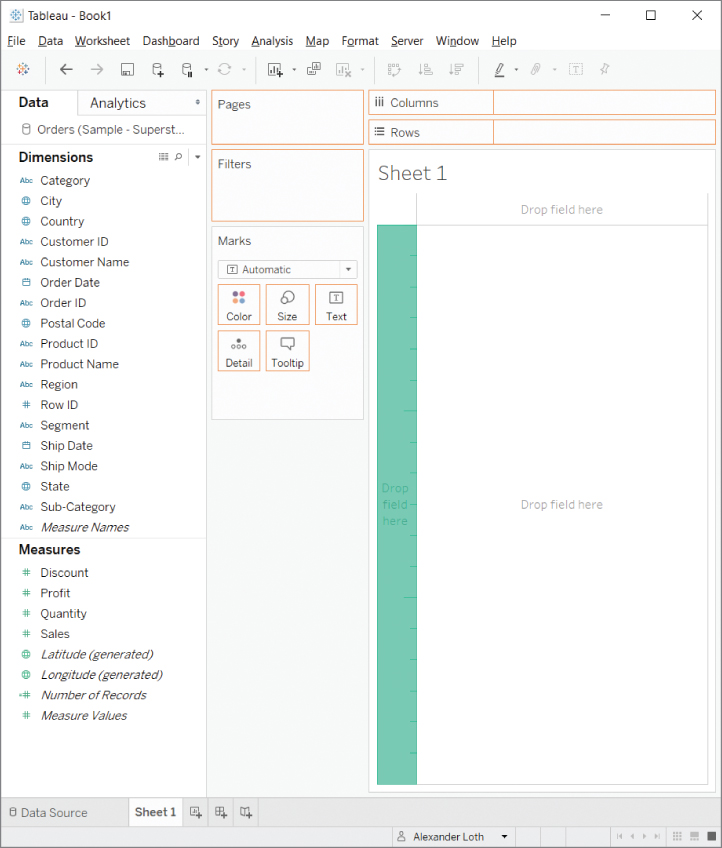
Figure 1.10 A green highlight appears when you drag a measure onto this section of the canvas.
Alternatively, you can drop the measure onto the Rows shelf above the canvas. The result is the same: you see the total sales revenue of all the records in the dataset.


