


FILLED MAPS
Filled maps that shade geographic areas in different colors can be created just as quickly as symbol maps.
First double‐click a geographic dimension containing information about geographic areas, such as State. Note that to show all states, you also may need to add the Country dimension to the view, depending on the locale set in Tableau. The dimension City that you used for the symbol map would not work here, as there are no area outlines for cities saved in Tableau. Cities can only be shown as points on maps.
Again, add a measure such as Sales, and then open the Show Me menu. Click the button for filled maps (next to symbol maps, which should be highlighted in this case). See Figure 6.2.
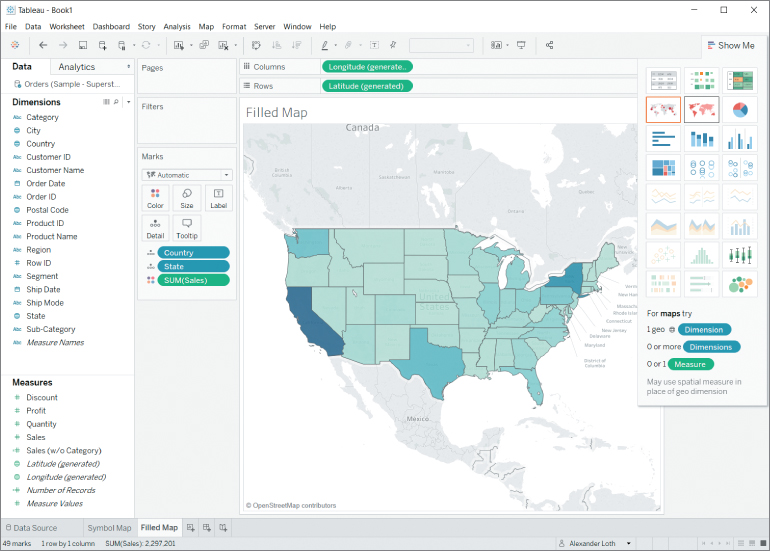
Figure 6.2 Filled map with states shaded according to the sum of sales.


