Working with visualizations
OMS makes visualizing your indexed and queried data incredibly easy. In the OMS and Log Analytics portals, there's a dedicated view designer feature with which you can create custom views and visualizations of your data. The new Analytics portal for Azure Log Analytics makes available immediate and powerful visualization capabilities for seamless visualization of your queried data.
How to do it...
Perform the following steps:
- Navigate to the
Azure portal(http://portal.azure.com) and sign in. - In the Azure portal, type
Log Analyticsin theSearch resourcessearch field and select your workspace. - In the Log Analytics blade for your workspace, click the
Log Searchbutton to take you to the search field. - In the
Log Searchpage, click on theAdvanced Analyticslink under the search box to take you to the Analytics portal:
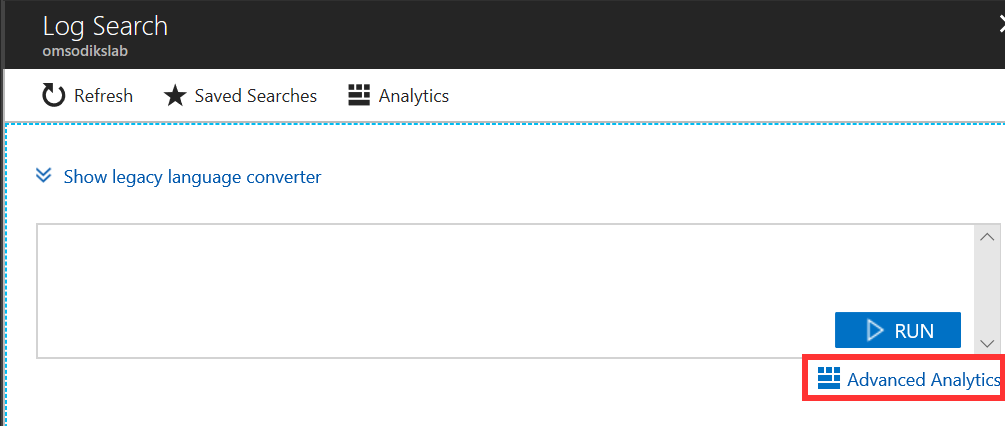
Figure 2.14
- In the Analytics portal, click on the
+button to open a new query tab:
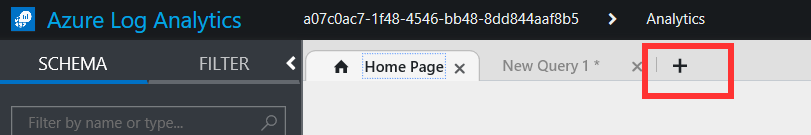
Figure 2.15
- In the new query field, type the following query into the search...