Reviewing the collected data
After you connect sources to your workspace and define the type of data that will be collected from your connected sources through the data sources, Log Analytics will start to collect data based on these criteria and the solutions that you have installed in your workspace, and you will start to see the relevant data in your workspace.
How to do it...
You can start by reviewing the solution-specific data in your workspace:
- In the OMS console, review the solution tiles in your workspace that correspond to the solutions you have installed in your workspace.
- Click the
Security And Auditsolution tile to enter theSolution Viewpage. - Once on the page, Log Analytics will present you with a list of recommended alerts that relate to the solution. Click
Enable alertsto enable the recommended alerts for the solution, and clickOkto close theRecommended alertspanel:
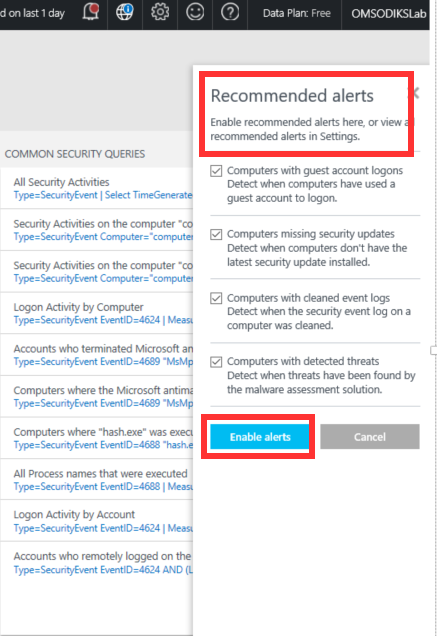
Figure 1.37 - Security & Audit solution dashboard
Note
You can view and manage all of your alerting rules by navigating to Settings | Alerts.
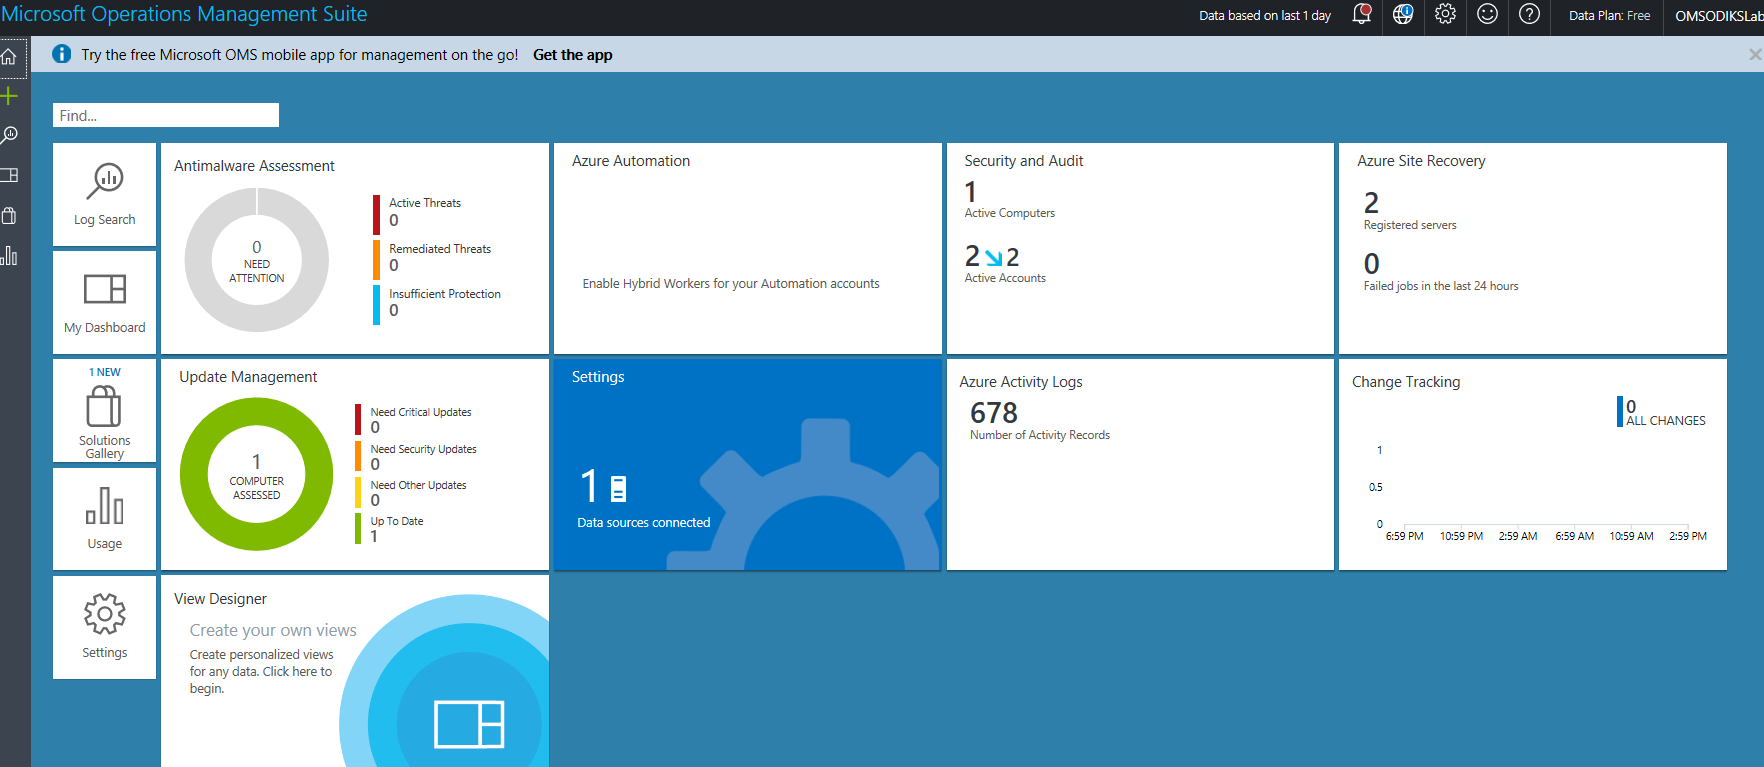
Figure 1.38 - Log Analytics workspace overview page
- On the
Security and Auditpage, review the visualization elements that comprise the view of the solution. Also, note the common security queries tile that suggests queries for specific security and audit scenarios. - Repeat steps 1-4 for any additional solutions in your workspace.
- From the OMS overview page, click
Log Search.
- In the Log Search page, enter the
search *character query into the search field and click Search:
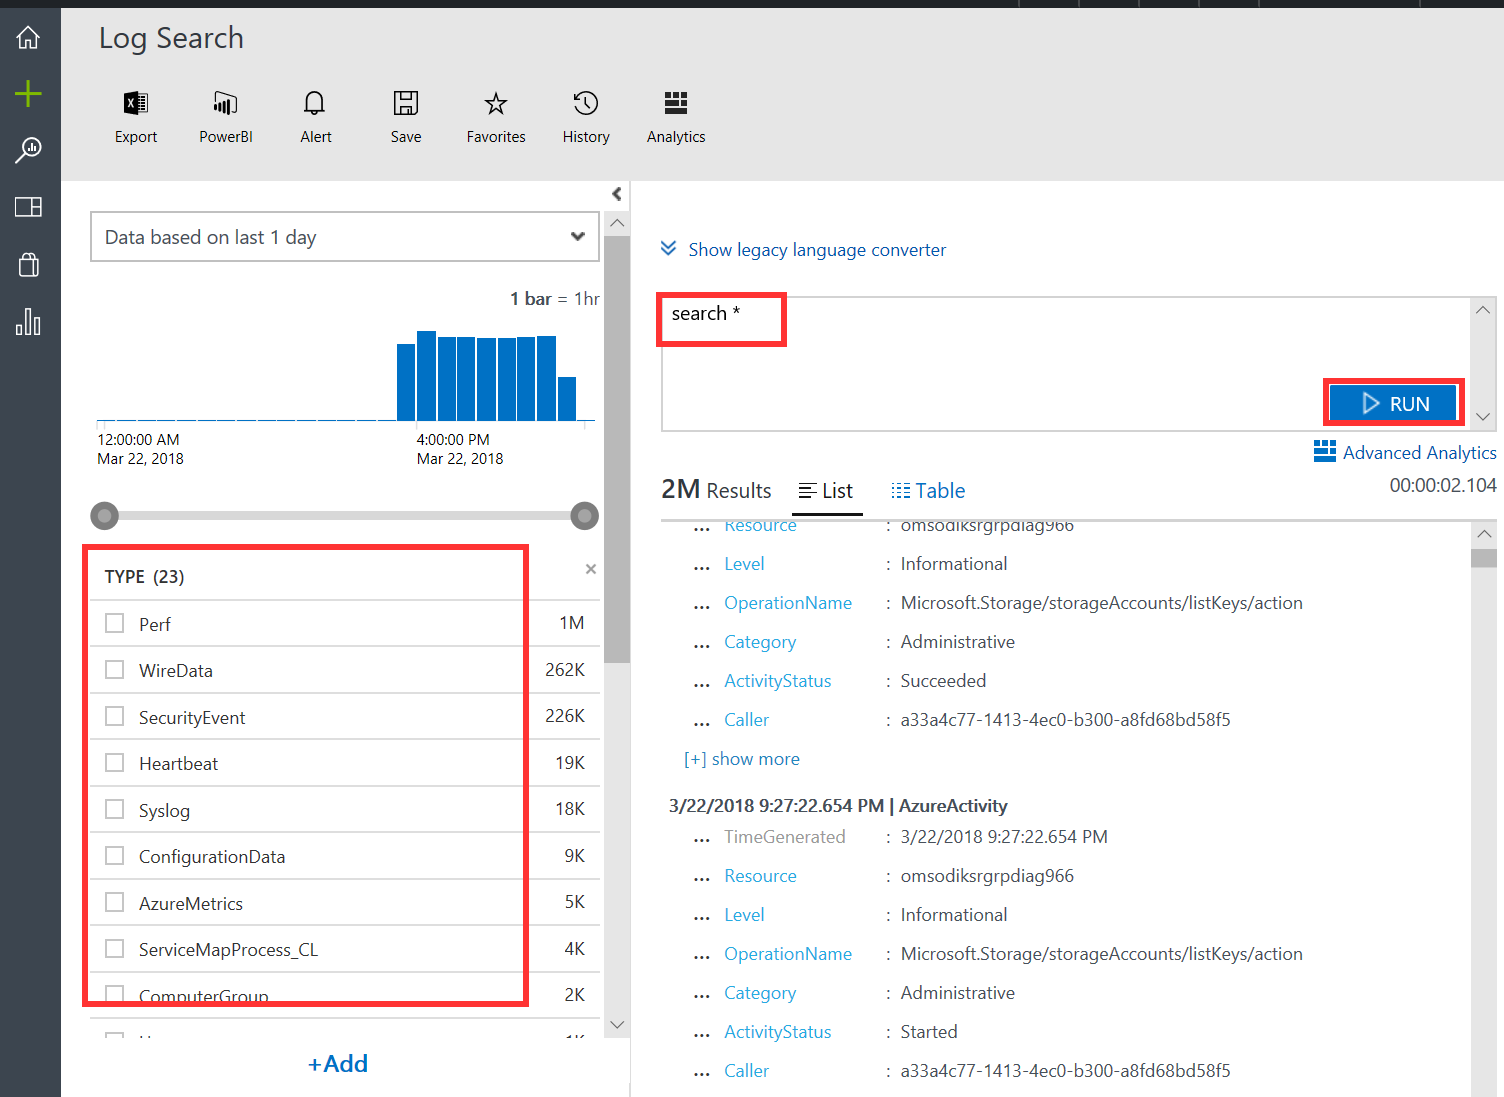
Figure 1.39 - OMS Log Analytics log search
The query returns results that are displayed in the Query Results field. You will also see various data types and field values on the left side of the Log Search page:
- Click on the
Perfdata type on the left side of your screen to return performance data. Note that when you make this selection, the log search modifies the query search to reflect your selection.
- Click on the
Tableperspective to see a different view of the resulting dataset:
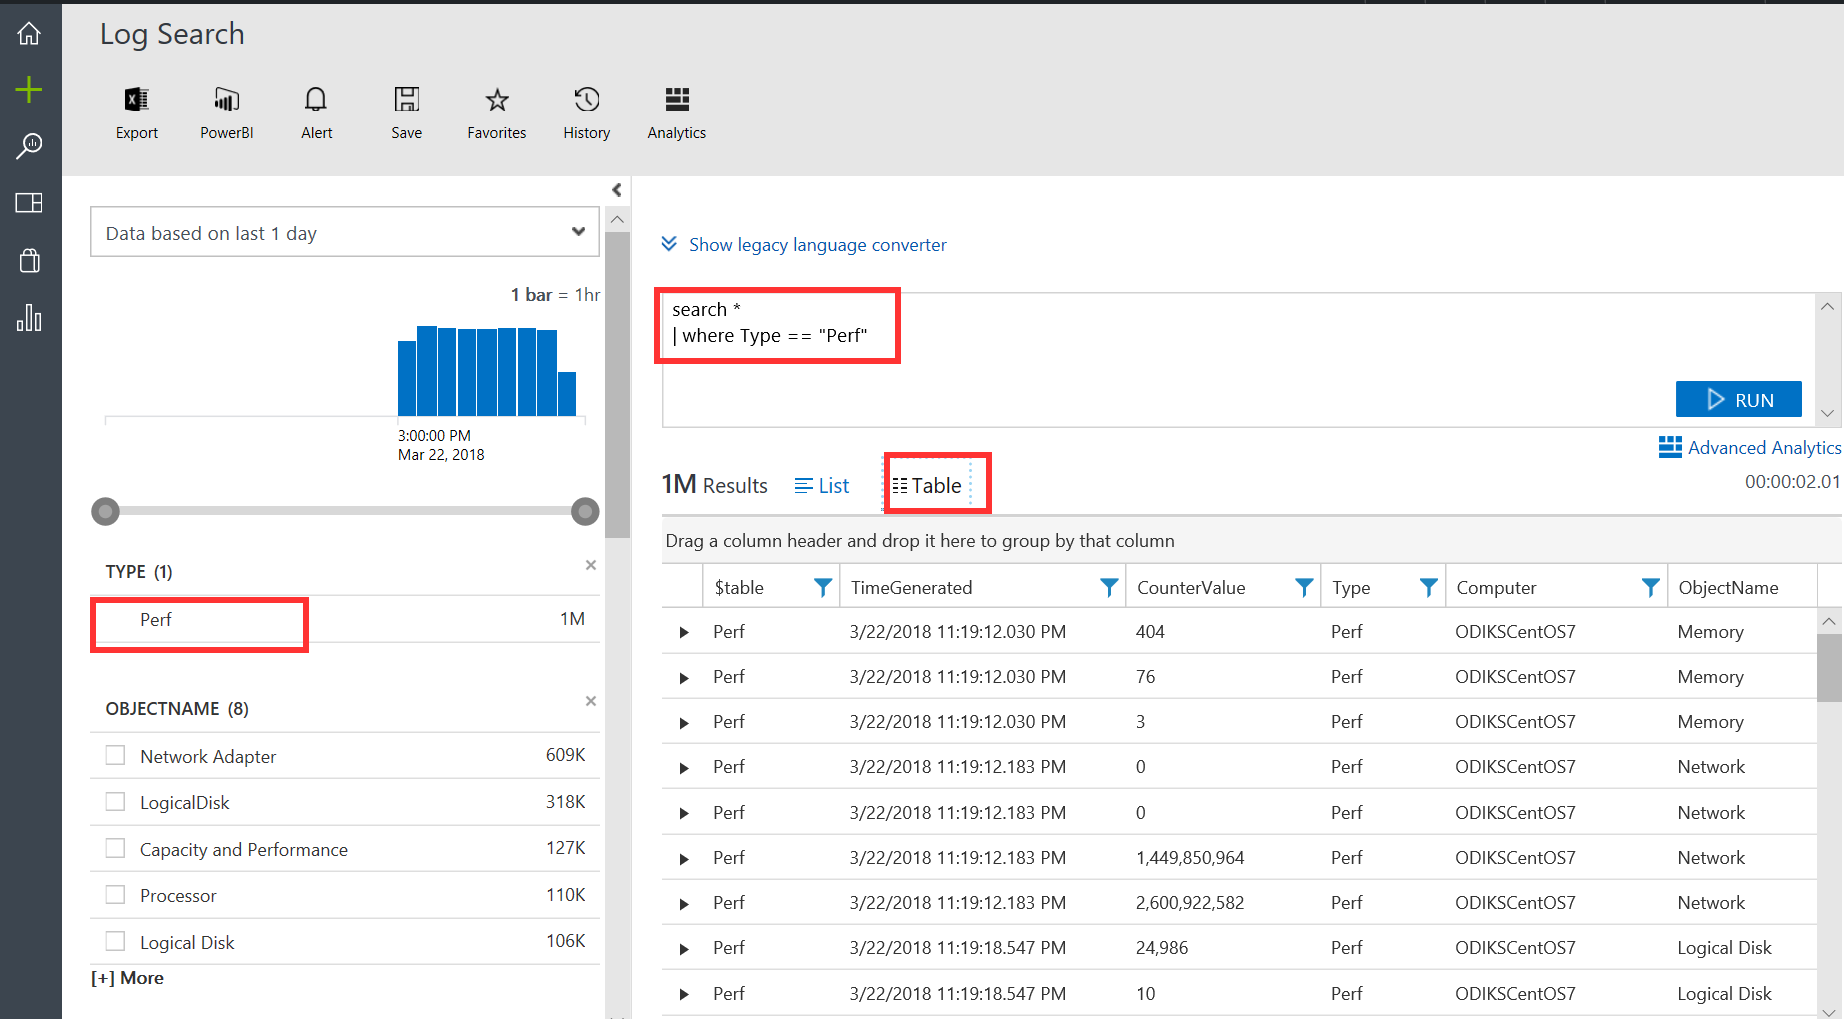
Figure 1.40 - Log Analytics performance data records
How it works...
Once data is collected in OMS, it is stored in the OMS data store as records. Records that are collected by the various data sources configured for a workspace will have unique properties, and will get tagged with a unique Type property that identifies that data record as being from a particular data source. For instance, Windows event log data, once collected in the OMS repository, will be assigned a tag of type Event. This means that in Log Analytics, you can search for non-security Windows event logs by specifying a query, such as Event, as the where condition for your filter. Similarly, performance counter data will get tagged as data of type Perf, and you can use the query Perf to filter for this sort of data.
All of the data collected in the OMS repository is tagged as such, and you can filter for any type of data once you know what the tag value, or type, of data it is. The OMS log search can enable you to further shape, filter, aggregate, and glean insights from your data. In the next chapter, you will learn how to use the OMS log search to glean insights from your data. You will also learn how to analyze and visualize your data using OMS and complementary tools.
See also
Visit the following links for more information:
- Log Analytics frequently asked questions (FAQs):https://docs.microsoft.com/en-us/azure/log-analytics/log-analytics-faq
- OMS pricing:https://www.microsoft.com/en-us/cloud-platform/operations-management-suite-pricing