Search icon CANCEL
Subscription
0
Cart icon
Your Cart (0 item)
Close icon
You have no products in your basket yet
Save more on your purchases! discount-offer-chevron-icon
Savings automatically calculated. No voucher code required.
Arrow left icon
All Products
Best Sellers
New Releases
Books
Videos
Audiobooks
Learning Hub
Newsletter Hub
Free Learning
Arrow right icon
timer SALE ENDS IN
0 Days
:
00 Hours
:
00 Minutes
:
00 Seconds
Arrow up icon
GO TO TOP
Tabular Modeling with SQL Server 2016 Analysis Services Cookbook

You're reading from   Tabular Modeling with SQL Server 2016 Analysis Services Cookbook Create better operational analytics for your users with these business solutions

Arrow left icon
Product type Paperback
Published in Jan 2017
Publisher Packt
ISBN-13 9781786468611
Length 372 pages
Edition 1st Edition
Languages
Arrow right icon
Author (1):
Arrow left icon
 Wilson Wilson
Author Profile Icon Wilson
Wilson
Arrow right icon
View More author details
Toc

Table of Contents (18) Chapters Close

Tabular Modeling with SQL Server 2016 Analysis Services Cookbook
Credits
About the Author
About the Reviewer
www.PacktPub.com
Customer Feedback
Preface
1. Introduction to Microsoft Analysis Services Tabular Mode FREE CHAPTER 2. Setting up a Tabular Mode Environment 3. Tabular Model Building 4. Working in Tabular Models 5. Administration of Tabular Models 6. In-Memory Versus DirectQuery Mode 7. Securing Tabular Models 8. Combining Tabular Models with Excel 9. DAX Syntax and Calculations 10. Working with Dates and Time Intelligence 11. Using Power BI for Analysis

Browsing your model with Microsoft Excel


Most users will want to use Microsoft Excel to interact with the data and perform analysis. By using Excel you can create many types of interactions with the data in the model. This recipe shows you how to connect to the model and build a Power View report.

How to do it...

  1. Open Microsoft Excel and create a new workbook.

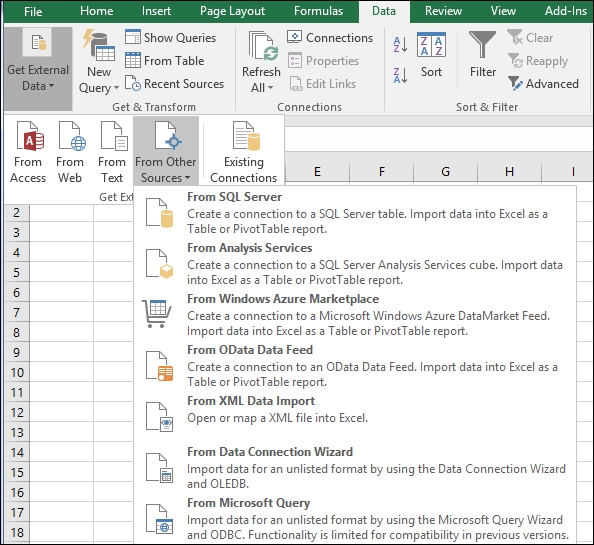
  2. Click on the Data ribbon and then select Get External Data | From Other Sources | From Analysis Services.

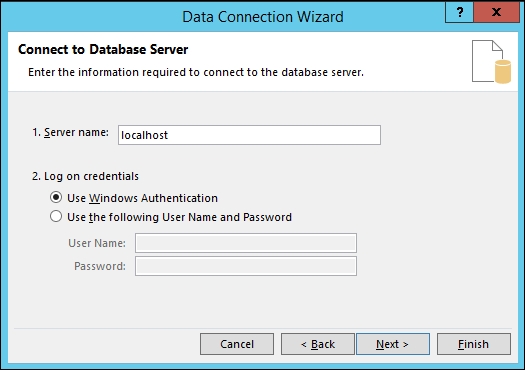
  3. Enter your Analysis Services Server name and Log on credentials on the next window.

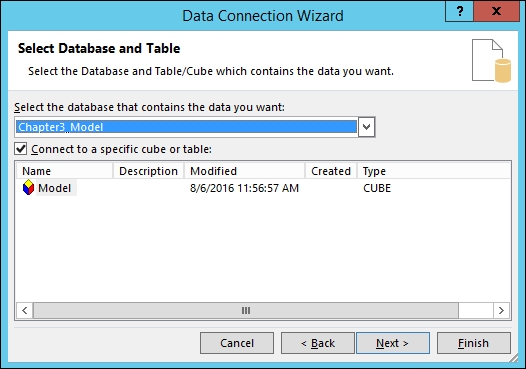
  4. Select Chapter3_Model from the drop-down list and click Next.

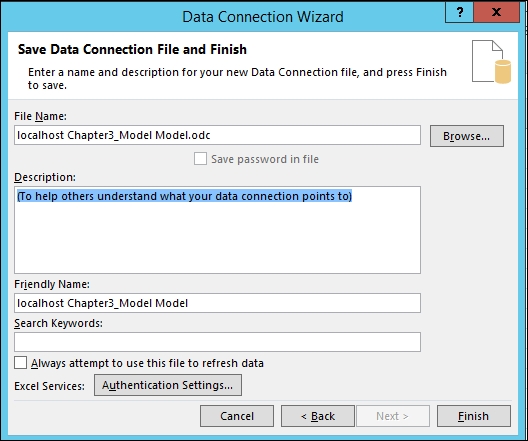
  5. On the next screen click Finish.

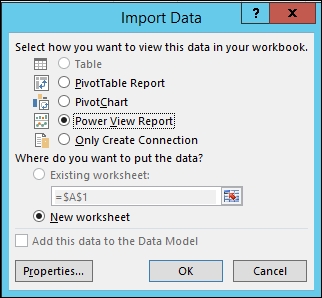
  6. Now you can Select how you want to view the data in Excel. If you have installed  Power View Report, select it and select OK.

  7. After connecting to the data you will have a new Power View sheet in Excel.

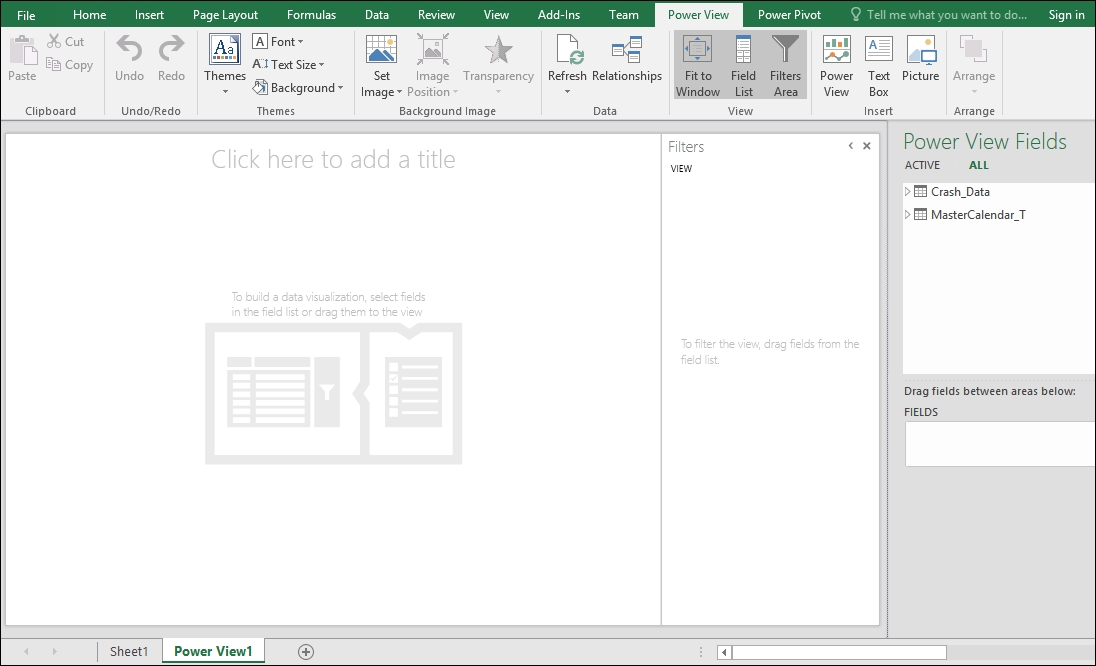
  8. Select Year from the MasterCalendar_TCalendar_YQMD hierarchy and drag it to the design surface. Then drag the CRASH_KEY from the Crash_Data table and...

lock icon The rest of the chapter is locked
Register for a free Packt account to unlock a world of extra content!
A free Packt account unlocks extra newsletters, articles, discounted offers, and much more. Start advancing your knowledge today.
Unlock this book and the full library FREE for 7 days
Get unlimited access to 7000+ expert-authored eBooks and videos courses covering every tech area you can think of
Renews at $15.99/month. Cancel anytime
Visually different images