
Using the browser's developer tools to analyze and alter basic behavior
Firebug is a browser add-on that allows us to analyze the inner components of a web page, such as table elements, CSS classes, and frames. It also has the ability to show us DOM objects, error codes, and request-response communication between the browser and server.
In the previous recipe, we saw how to look into a web page's HTML source code and found a hidden input field that established some default values for the maximum size of a file. In this recipe, we will see how to use the browser's debugging extensions, in this particular case, Firebug for Firefox, or OWASP Mantra.
How to do it...
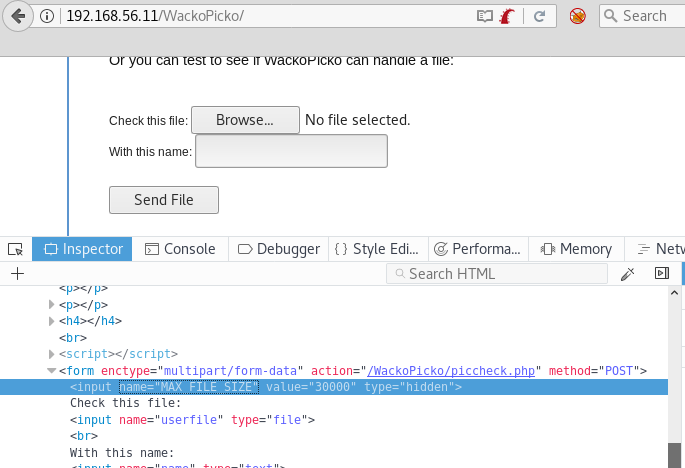
With vm_1 running, go to your Kali VM and browse to http://192.168.56.11/WackoPicko:
- Right-click on
Check this fileoption and then selectInspect Element:
Note
A browsers developer tools can also be triggered using F12, or Ctrl + Shift + C.
There is a
type="hidden"parameter on the first input of the form; double-click onhiddento select...