Starting the capture of data
After we have located Wireshark in the network, in this recipe, we will learn how to start capturing data and what we will get in various capture scenarios.
Getting ready
After you've installed Wireshark on your computer, the only thing to do will be to start the analyzer from the desktop, program files, or the quick start bar.
Note
To keep consistency, this book is written for Wireshark version 2.0.2 from February 2016. In general (but not always), if you look at the version number X Y Z, when the X changes it will be a major release (like version 2), that changes every several years and occur the software completely. When the Y changes, it will usually be additional features or significant changes in some features, and if the Z changes, it will usually be bug fixes and new protocol dissectors. Since new minor releases are released usually every few weeks, you can have a quick look at their release notes.
When you do so, the following window will be opened (version 2.0.2):
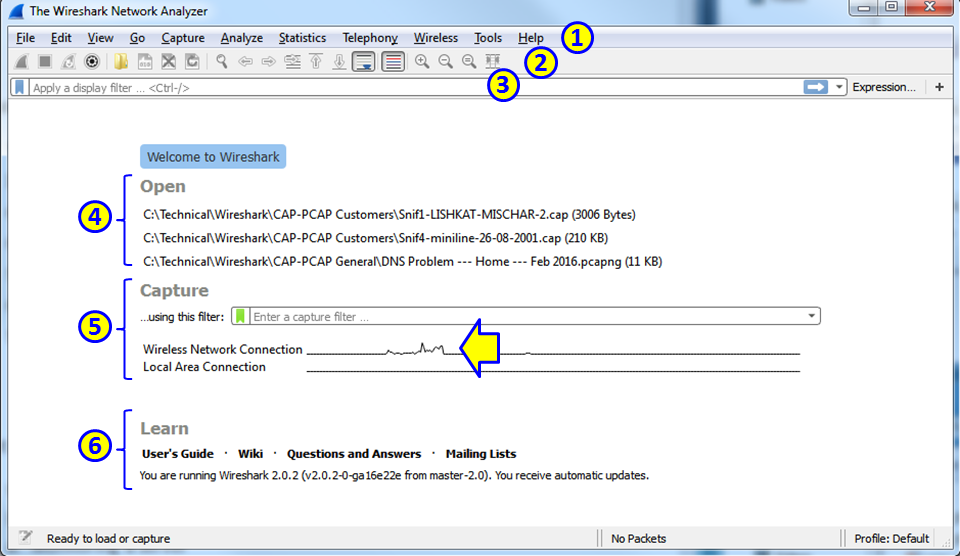
In the start window, you will see the following sections:
- The
main menu, with file, edit and view operations, capture, statistics, and various tools. - The
main toolbarthat provides quick access to frequently used items from the menu. - The
filter toolbar, it provides access to the display filters.
In the main area of the start window, we have the following items:
- A list of files that were recently opened
- A
Capturepart that enables us to configure a capture filter and shows us the traffic on our computer interfaces
Note
Seeing traffic on computer interfaces is a nice improvement from version 1, as it enables us to quickly see the active interfaces and start the capture on them.
- The
Learnpart can take us directly to the manual pages
How to do it...
In Wireshark Version 2, it is very simple. When you run the software, down the main window, you will see all the interfaces with the traffic that runs over them. See the following screenshot:
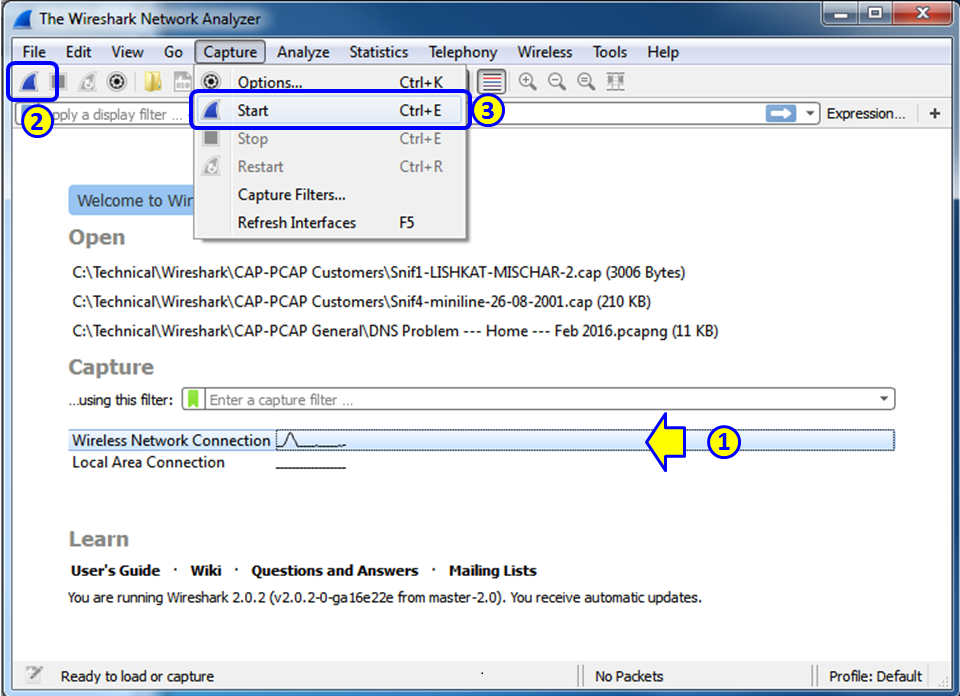
The simplest way to start a simple single-interface capture is simply to double-click on the active interface (1). You can also mark the active interface and click on the capture button on the upper-left corner of the window (2), or choose Start or Ctrl + E from the Capture menu (3).
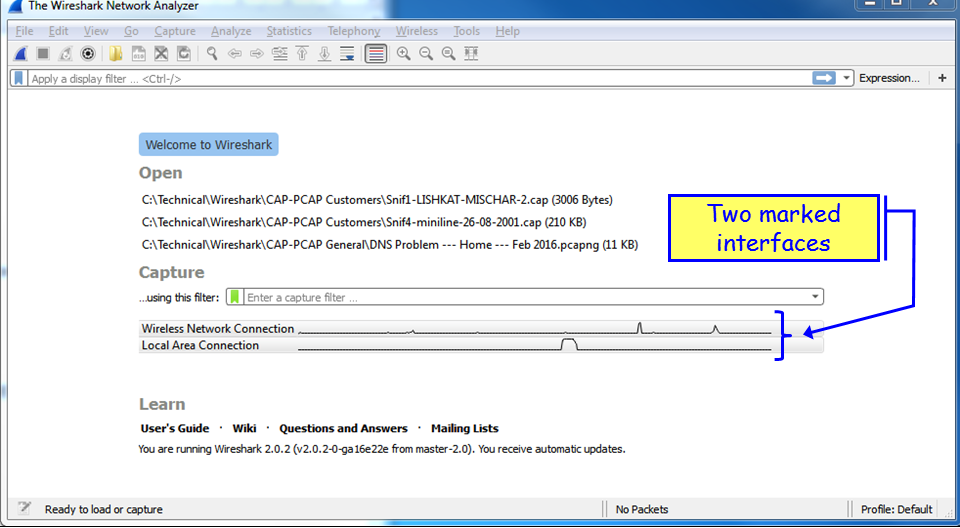
Capture on multiple interfaces
In order to start the capture on multiple interfaces, you simply use Windows Ctrl or Shift keys, and left-click to choose the interfaces you want to capture data from. In the following screenshot, you see that the Wireless Network Connection and the Local Area Connection are picked up:
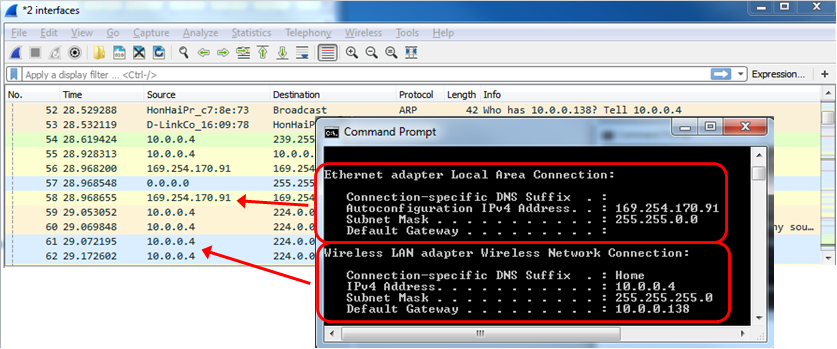
And the traffic that you will get will be from the two interfaces, as you can see from the next screenshot: 10.0.0.4 on the wireless interface, and 169.254.170.91 Automatic Private IP Address (APIPA) on the LAN interface.
Note
APIPA address is an address allocated automatically when you configure your device to use a DHCP client, and no address is acquired. The APIPA address is like any other address and can be used locally, but it is usually used to notify that your DHCP server is not available.
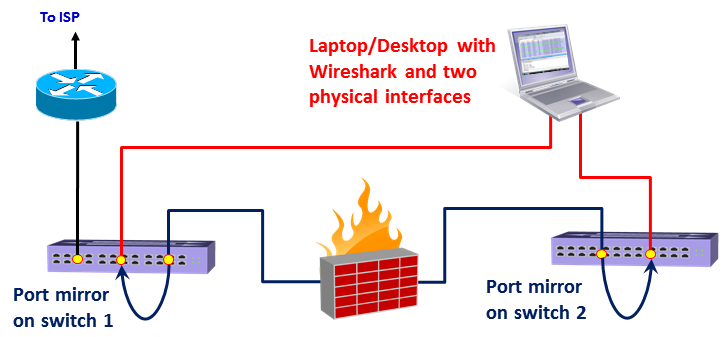
Using capture on multiple interfaces can be helpful in many cases, for example, when you have multiple physical NICs, you can port monitor two different servers, two ports of a router or any other multiple ports at the same time. A typical configuration is seen in the following screenshot:
How to configure the interface you capture data from
- To configure the interface you capture data from, choose
Optionsfrom theCapturemenu. The following window will appear:
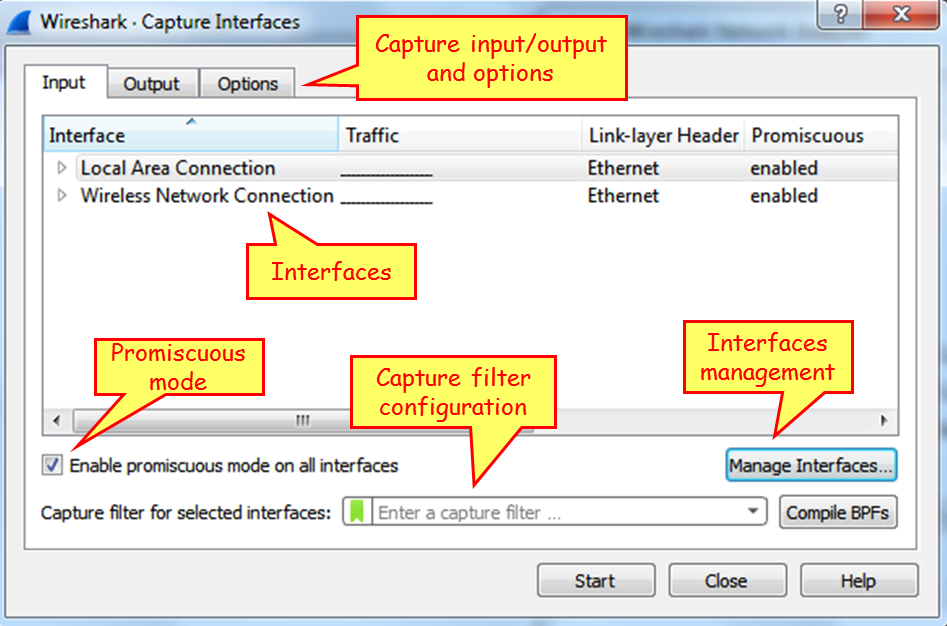
In this window you can configure the following parameters:
- On the upper side of the window, on the main window, choose the interface on which you want to capture the data from. If no additional configuration is required, click on
Startto start the capture. - On the lower-left side, you have the checkbox
Use promiscuous mode on all interfaces. When checked, Wireshark will capture all the packets that the computer receives. Unchecking it will capture only packets intended for the computer.
Note
In some cases, when this checkbox is checked, Wireshark will not capture data in the wireless interface, so if you start capturing data on the wireless interface and see nothing, uncheck it.
- In the middle of the screen, right below the interfaces window, you can configure the capture filter. We will learn capture filters in Chapter 3, Using Capture Filters.
On top of the window, we have three tabs:Input(opens by default),Output, andOptions.
Capture data to multiple files
Click on the Output tab, and the following window will open:
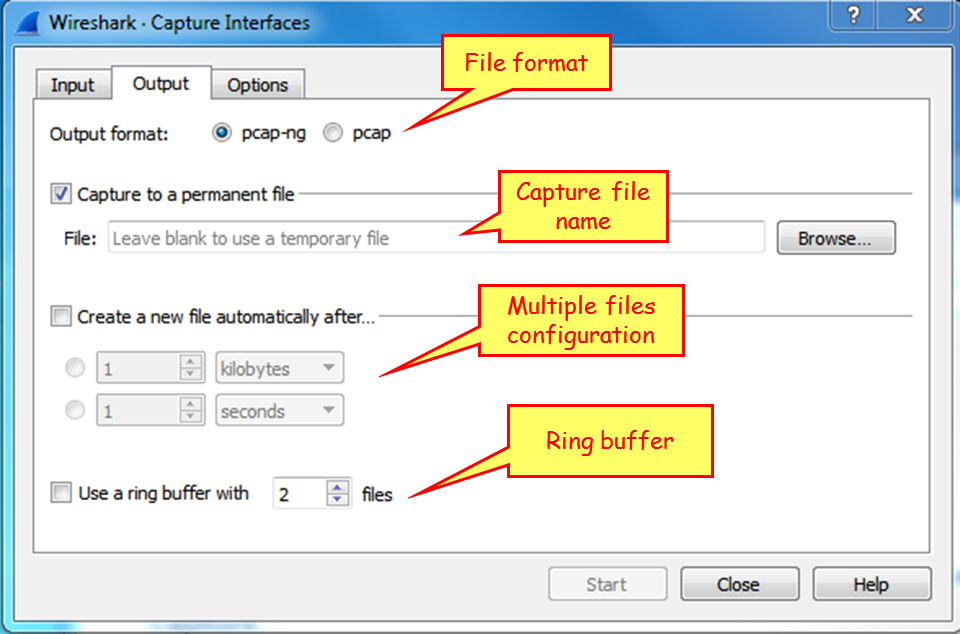
This window enables capture in multiple files. To configure this, write a filename in theCapture to a permanent filearea. Wireshark will save the captured file under this name, with extensions 0001, 0002, and so on, all under the path that you specify in theBrowse...button. This feature is extremely important when capturing a large amount of data, for example, when capturing data over a heavily loaded interface, or over a long period of time. You can tell the software to open a new file after a specific amount of time, file size, or number of packets.
Configure output parameters
- When you choose the
Optionstab, the following window will open.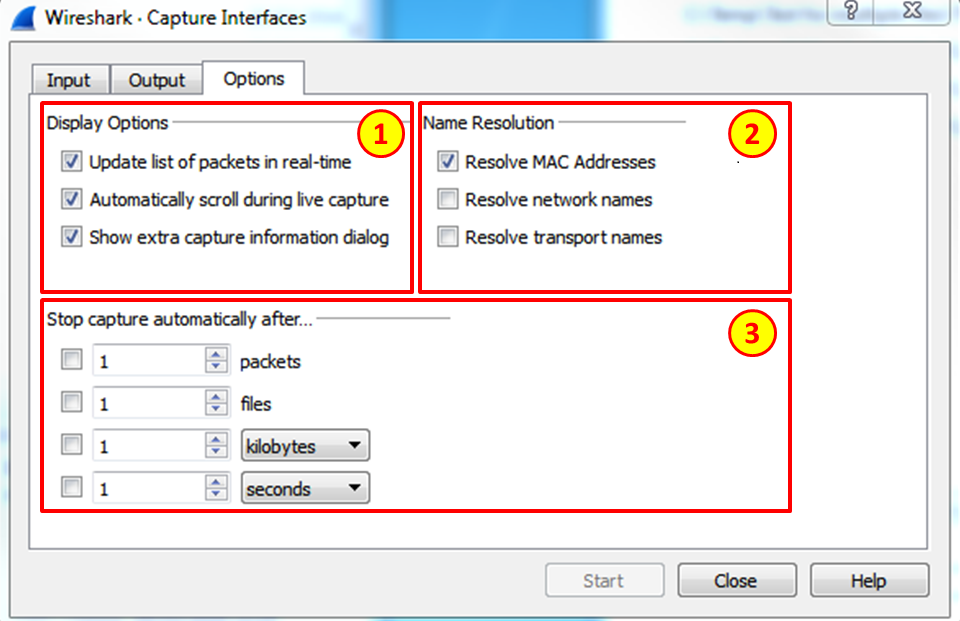
- On the left (1), you can choose
Display Options. These options are:Update list of packets in real-time: Upon checking this option, Wireshark updates packets in the packet pane in real timeAutomatic scroll during live capture: Upon checking this, Wireshark scrolls down packets in the packet pane as new packets come inHide capture info dialog: By checking this, the capture info dialog is hidden
- On the right, there is the
Name Resolutionoption. Here we can check for:- The MAC address resolution that resolves the first part of the MAC address to the vendor ID.
- The IP address resolution that is resolved to DNS names.
- TCP/UDP port numbers that are resolved to application names. These are the port numbers; for example, TCP port 80 will be presented as HTTP, port 25 as SMTP, and so on.
Note
There are some limitations to Wireshark name resolution. Even though Wireshark caches DNS names, resolving IP addresses is a process that requires DNS translation, and therefore it can slow down the capture. The process itself also produces additional DNS queries and responses, which you will see on the capture file. Name resolution can often fail, because the DNS you are querying is not necessarily familiar with the IP addresses in the capture file. For all these reasons, although network name resolution can be a helpful feature, you should use it carefully.
Manage interfaces (under the Input tab)
- As you see in the following screenshot, on the bottom-right, you have the
Manage Interfaces...button with three tabs;Local Interfaces,PipesandRemote Interfaces. These are the options that Wireshark can capture data from: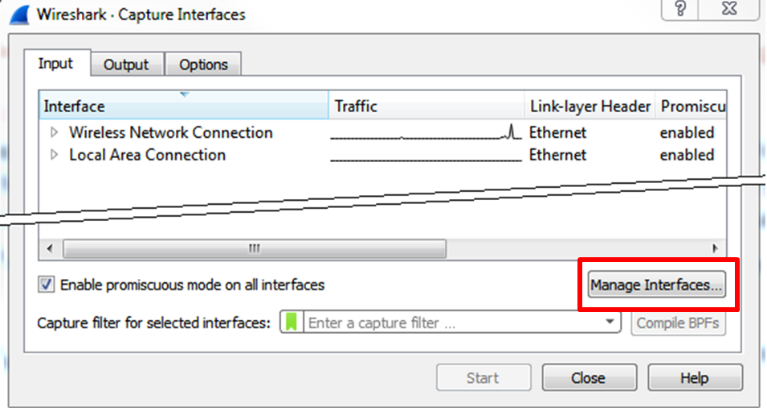
- When you choose the
Manage Interfaces...button and theInputtab, you will see a list of available local interfaces, including the hidden ones, which are not shown in the other list: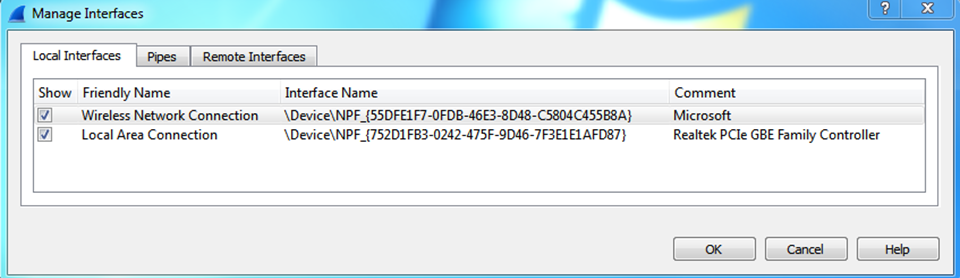
- Wireshark can also read captured packets from another application in real time.
Capture packets on a remote machine
For capturing data from a remote machine, perform the following actions:
- Install the pcap driver on the remote machine. You can find it at http://www.winpcap.org/ or install the entire Wireshark package instead.
- For capturing data on the remote machine, choose
Options|Capture Interfaces |Manage Interfaces|Remote Interface. The following window will open: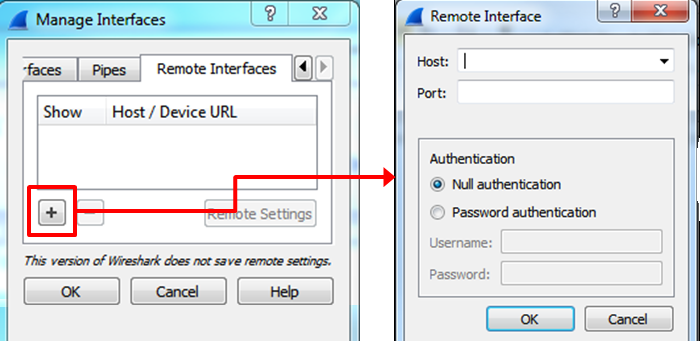
- On the local machine:
Host name: The IP address or host name of the remote machinePort: 2002:You can leave it open and it uses the default2002Password authentication: The username and password of the remote machine.
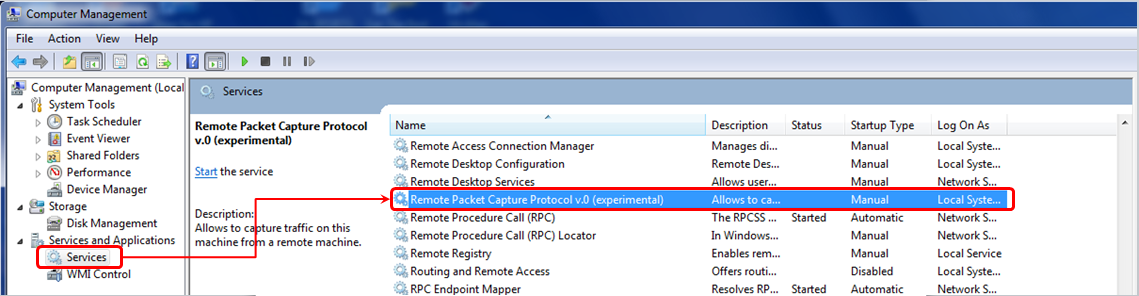
- On the remote machine:
- Install WinPcap on the remote PCs that you want to collect data from. You can get it from http://www.winpcap.org/. You don't need to install Wireshark itself, only WinPcap.
- Configure the firewall is open to TCP port
2002from your machine. - On the remote PC, add a user to the PC user list, give it a password, and administrator privileges. You configure this from
Control Panel |Users Accounts and Family Safety|Add or remove user accounts|create a new account. - Right-click on the
Startsymbol down to the left of the Windows screen, chooseOpen Windows Explorer, right-click onComputer, and chooseManage. In theManagewindow, open the services, as illustrated here:
- You will see the interface you have configured on the remote interfaces, and when you click on
OK, you will also see it on the local interfaces' list. Now you can capture packets on it as if it was a local interface on your machine.
Note
This feature can be useful when, for example, you monitor connectivity between your PC and a remote one, or even between two remote machines. When you implement it, you will see the packets that are living on the device; then you will see them arrive (or not!) at the other device, which is a very powerful tool.
This file is attached as Cap_B05518_01_01.
Start capturing data – capture data on Linux/Unix machines
In Linux and Unix devices, we have the good oldTCPDUMP utility, actually the command that the Wireshark came from.
For using TCPDUMP, you have the following commands (the most common ones):
- Capture packets on a specific interface:
- Syntax is tcpdump -i <interface_name>
- Example is tcpdump -i eth0
- Capture and save packets in a file:
- Syntax is tcpdump -w <file_name> -i <interface_name>
- Example is tcpdump -w test001 -i eth1
- Read captured packets' file:
- Syntax is tcpdump -r <file_name>
- Example is tcpdump -r test001
To use capture filters, use the capture filters format described in Chapter 3,Using Capture Filters.
Collecting from a remote communication device
In this section, we will describe how to capture data from remote communication equipment. Since there are many vendors that support this functionality, we will provide the general guidelines for this feature for some major vendors, along with links to their website, to get the exact configurations.
The general idea here is that there are some vendors that allow you to collect captured data locally, and then to download the capture file to an external computer.
For Cisco devices, this feature is called Embedded Packet Capture (EPC), and you can find how to do it in the following link: http://www.cisco.com/c/en/us/support/docs/ios-nx-os-software/ios-embedded-packet-capture/116045-productconfig-epc-00.html. In this link you can find how to configure the capture for Cisco IOS and IOS-XE operating systems.
For Juniper devices, the command is called monitor traffic, and you can find a detailed description of it at http://www.juniper.net/techpubs/en_US/junos14.1/topics/reference/command-summary/monitor-traffic.html.
For check point firewalls, you can use the utility fw monitor, explained in detail at http://dl3.checkpoint.com/paid/a4/How_to_use_FW_Monitor.pdf?HashKey=1415034974_a3bca5785be6cf8b4d627cfbc56abc97&xtn=.pdf.
For additional information, check out the specific vendors. Although capturing data on the LAN switch, router, firewall, or other communication devices and then downloading the file for analysis is usually not the preferred option, keep it in mind and remember that it is there if you need it.
How it works...
Here the answer is very simple. When Wireshark is connected to a wired or wireless network, there is a software driver that is located between the physical or wireless interface and the capture engine. In Windows, we have the WinPcap driver; in Unix platforms, we have the Libpcap driver; and for wireless interfaces, we have the Airpcap driver.
There's more...
In cases where the capture time is important, and you wish to capture data on one interface or more, and you want to be time-synchronized with the server you are monitoring, you can use Network Time Protocol (NTP) for this purpose, and synchronize your Wireshark and the monitored servers with a central time source.
This is important in cases where you want to go through the Wireshark capture file in parallel to a server log file, and look for events that are shown on both. For example, if you see retransmissions in the capture file at the same time as a server or application error on the monitored server, then you will know that the retransmissions are because of server errors and not because of the network.
The Wireshark software takes its time from the OS clock (Windows, Linux, and so on). To configure the OS to work with a time server, go to the relevant manuals of the operating system that you work with.
In Microsoft Windows 7, configure it as follows:
- Go to
Control Panel - Choose
Clock, Language, and Region - Under
Date and Time, ChooseSet the time and date. Change to theInternet timetab - Click on the
Change Settingsbutton - Change the server name or IP address
Note
In Microsoft Windows 7 and later, there is a default setting for the time server. As long as all devices are tuned to it, you can use it like any other time server.
NTP is a network protocol used for time synchronization. When you configure your network devices (routers, switches, fws, and so on) and servers to the same time source, they will be time synchronized to this source. The accuracy of the synchronization depends on the accuracy of the time server that is measured in levels or stratum. The higher the level is, it will be more accurate. Level 1 is the highest. The higher the level, the lower the accuracy. Usually you will have level 2 to 4.
NTP was first standardized in RFC 1059 (NTPv1) and then in RFC 1119 (NTPv2). The common versions in the last few years are NTPv3 (RFC1305) and NTPv4 (RFC 5905).
You can get a list of NTP servers on various websites, some of them are: http://support.ntp.org/bin/view/Servers/StratumOneTimeServers And http://wpollock.com/AUnix2/NTPstratum1PublicServers.htm
See also
You can get more information about the Pcap drivers from:
- For WinPcap visit: http://www.winpcap.org
- For Libpcap visit: http://www.tcpdump.org