Monitoring RDS DB instances
By default, RDS provides you with some default metrics that you can use to monitor the RDS instances. RDS provides metrics for the following items:
- The number of connections to a DB instance
- The amount of read and write operations to a DB instance
- The amount of storage that a DB instance is currently utilizing
- The amount of memory and CPU being utilized for a DB instance
- The amount of network traffic to and from a DB instance
To get a list of the default metrics provided for the specific DB instance mywebappprd, you can use the following command:
PS C:\> $p1 = New-Object Amazon.CloudWatch.Model.DimensionFilter
PS C:\> $p1.Name = "DBInstanceIdentifier"
PS C:\> $p1.Value = "mywebappprd"
PS C:\> Get-CWMetricList -Namespace "AWS/RDS" -Dimension $p1
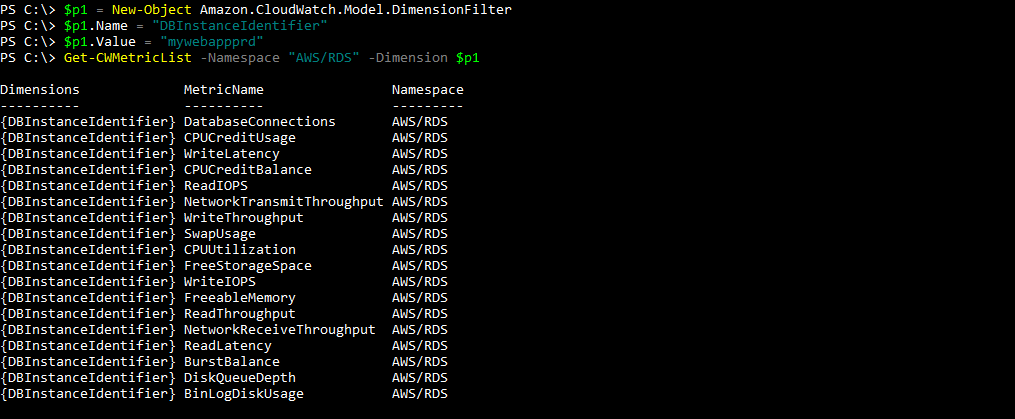
Note that the namespace name for RDS is AWS/RDS, which you use with cmdlet. You can create an alarm the same way as we did for the EC2 instance. To start with, you may be interested in creating an alarm for FreeStorageSpace...