
Confusion matrix for test group
The results for the test group are similar to those of the training group. Any discrepancies between test and training would warrant looking more closely at the model and observing how the data was sampled or split:
#Confusion matrix for TEST group
result <- sql("select outcome,correct, count(*) as k, avg(totrows) as totrows from preds_tbl where grp=0 group by 1,2 order by 1,2")
result$classify_pct <- result$k/result$totrows
display(result)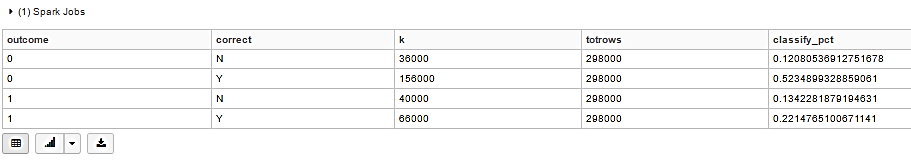
Add up the correct calculation is a similar way to the training group. The results are slightly less, which is normal when comparing test to training results :
Summary of Correct Predictions for Test Group:
Correctly predicted outcome=1 | 22% |
Correctly predicted outcome=0 | 52% |
Total Correct Percentage | 74% |
Distribution of average errors by group
Distribution of errors is another that you can look at how well a model has fit the data. In this analysis, we look at the distribution of errors for all four combinations of the following...