After we've explained processes, threads, and the execution of the PE files, now it's time to start debugging a running process and understanding its functionality through tracing over its code in the runtime.
Dynamic analysis with OllyDbg/immunity debugger
Debugging tools
There are multiple debugging tools we can use, and here we will just give three examples that are very similar in their UIs and actually have a lot of code in common (at least two of them):
- OllyDbg: This is the most well-known debugger in the Windows platform, and its UI has become the standard for most Windows debuggers:
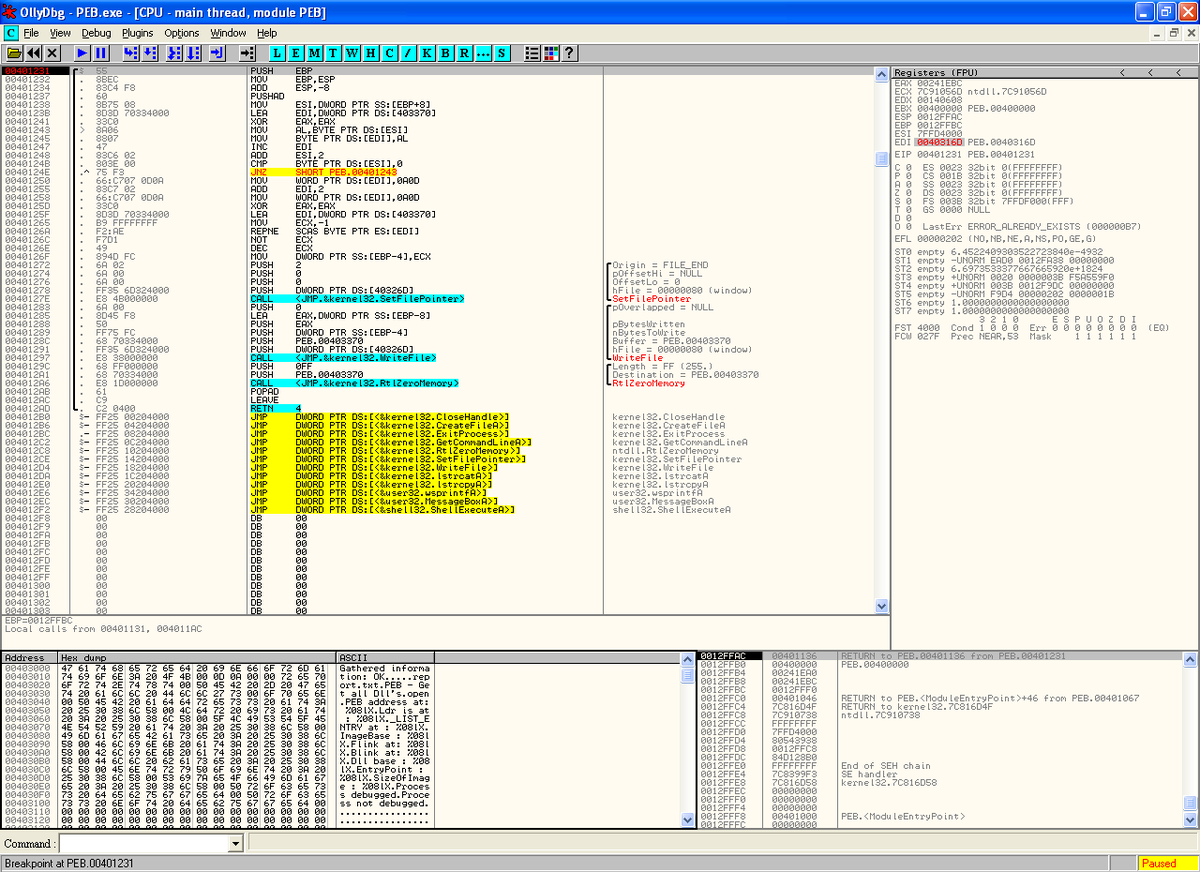
Figure 15: OllyDbg UI
- Immunity Debugger: This is basically a scriptable clone of OllyDbg, and was created mainly for...