Configuring a flow graph for viewing TCP flows
In this recipe, we will learn how to use the flow graph feature.
Getting ready
Open Wireshark, click Statistics, and choose Flow Graph around the middle of the statistics menu.
How to do it...
Choosing flow graph, the following window will open:
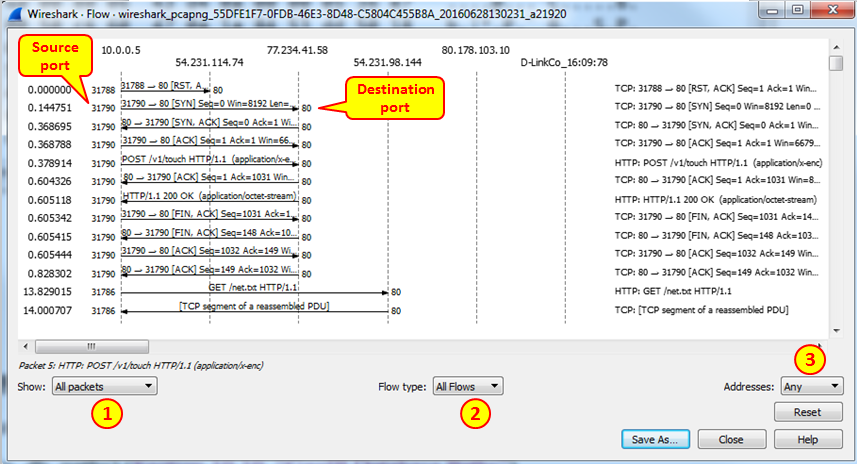
In the window, we see the packet time on the left, the originating and destination addresses of the packets, as well as the port numbers on the two sides of the flow arrows.
Clicking on one of the session arrows will bring you to the packet in the Wireshark main window packet list pane.
You can choose from several options in the flow graph window:
- Show all the captured packets or just displayed packets, filtered by display filter.
- Show all flows or just TCP flows. This will show only TCP operation, for example, in HTTP requests it will show that it is a TCP PUSH (explained in Chapter 12, FTP, HTTP/1, and HTTP/2), and the fact that it is an HTTP
GETcommand. - Show any type of address, for example MAC addresses,...