Configuring the start window
In this recipe, we will see some basic configurations for the start window. We will talk about configuring the main window, file formats, and viewing options.
Getting ready
Start Wireshark, and you will get the start window. There are several parameters you can change here in order to adapt the capture window to your requirements:
- Toolbars configuration
- Main window configuration
- Time format configuration
- Name resolution
- Auto scroll in live capture
- Zoom
- Column configuration
First, let's have a look at the menu and the toolbars that are used by the software:
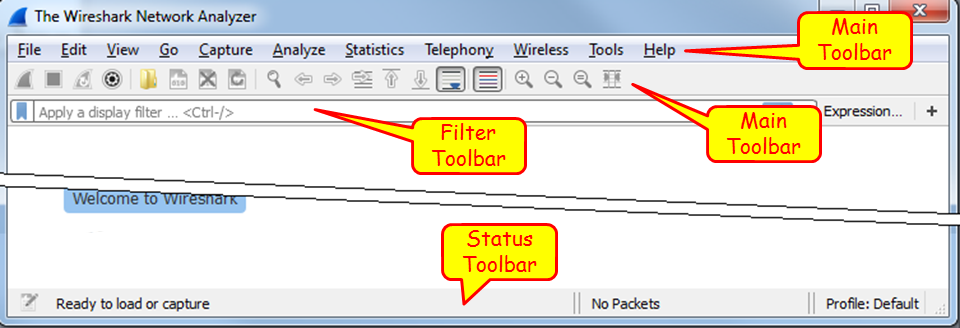
The main menu
Wireshark's main menu is located at the top of the main window. In the main toolbar you have the following symbols:
File: File operations such as open and save file, export packets, print, and so on.Edit: To find packets, mark packets, add comments, and most importantly, use the preferences' submenu. This will be described in Chapter 2, Mastering Wireshark for Network Troubleshooting.View: For configuring Wireshark display, colorization of packets, zooming, font changes, showing a packet in a separate window, expanding and collapsing trees in packet details, and so on.Go: To go to a specific packet, for example, to the first packet in the capture, the last packet, a packet number, and so on.Capture: To configure capture options and capture filters.Analyze: For analysis and display options like display filter configuration, decode options, to follow a specific stream, and so on.Statistics: To show statistics, starting from the basic hosts and conversations statistics up to the smart IO graphs and stream graphs.Telephony: For displaying IP telephony and cellular protocols information, for example, RTP and RTCP, SIP flows and statistics, GSM or LTE protocols, and so on.Wireless: For showing Bluetooth and IEEE 802.11 wireless statistics, later described in Chapter 9, Wireless LAN.Tools: For Lua operations as described inAppendix 4,Lua programming.Help: For user assistance, sample capture updates, and so on.
The main toolbar
The main toolbar provides quick access to frequently used items from the menu. This toolbar can be hidden using the View menu.
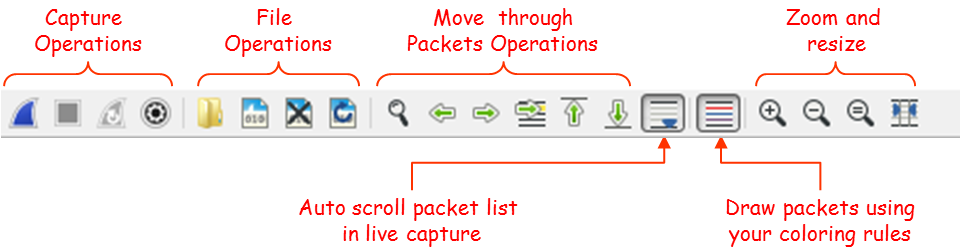
The four left-most symbols are for capture operations, then you have symbols for file operations, go to packet operations, auto-scroll, draw packets using coloring rules, zoom and resize.
Display filter toolbar
In the filters toolbar, you have the following symbols:
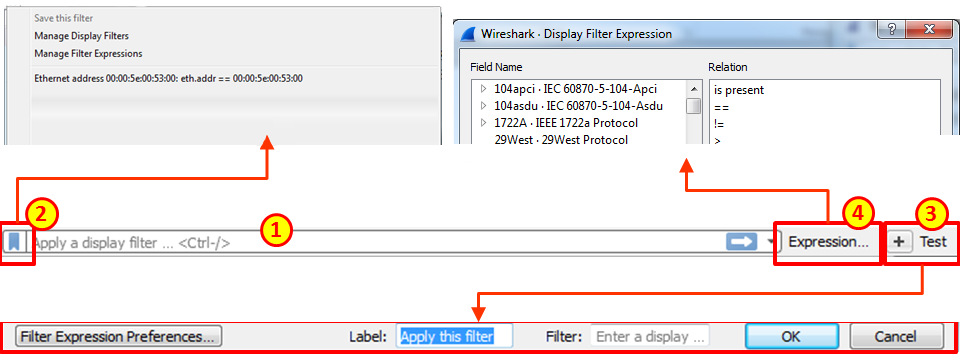
In the display filter toolbar we can:
- Type in a display filter string, with auto complete while showing us previously configured filters
- Manage filter expressions that allow you to bring up filter construction dialog for filter construction assistance
- Configure a new filter and add it to the preferences
- Use filter predefined expressions, and choose a filter
An enhanced description of splay filters is provided in Chapter 4, Using Display Filters.
Status bar
In the status bar, at the lower side of the Wireshark window, you can see the following data:
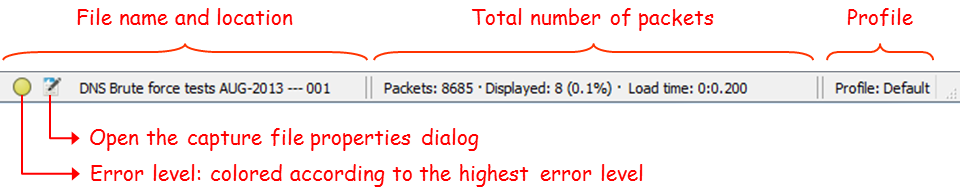
You can see here:
- Any errors in the expert system.
- The
Capturefile properties, including file information, capture time, time and general statistics. - The name of the captured file (during capture, it will show you a temporary name assigned by the software).
- Total number of captured packets, displayed packets (those which are actually displayed on the screen), and load time, that is, the time it took to load the capture file.
- The profile you work with. For more information of profiles, you can read Chapter 2, Mastering Wireshark for Network Troubleshooting.
How to do it...
In this part, we will go step by step and configure the main menu.
Toolbars configuration
Usually for regular packet capture, you don't have to change anything. This is different when you want to capture wireless data over the network (not only from your laptop); you will have to enable the wireless toolbar, and this is done by clicking on it under the view menu, as shown in the following screenshot:
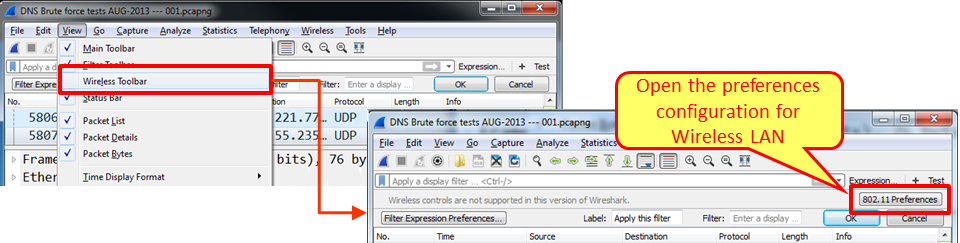
Wireless toolbar
When marking the Wireless Toolbar option in the View menu, the wireless toolbar opens. The only option available in the current version is to start the preferences' configuration window. There is more about Wireless LAN analysis in Chapter 9, Wireless LAN.
Main window configuration
To configure the main menu for capturing, you can configure Wireshark to show the following windows:
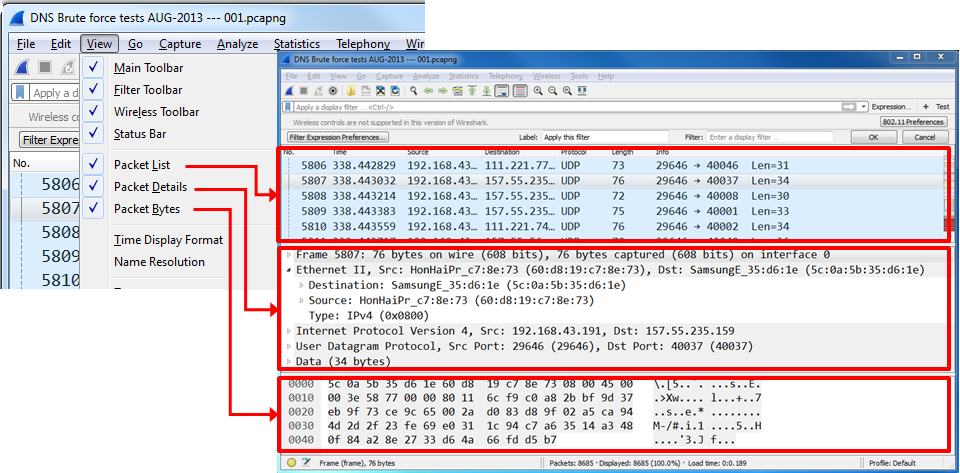
In most of the cases, you will not need to change anything. In some cases, when you don't need to see the packet bytes, you can cancel them, and you will get more space for the packet list and details.
Name resolution
Name Resolution is the translation of layer 2 (MAC addresses), layer 3 (IP addresses), and layer 4 (port numbers) into meaningful information.
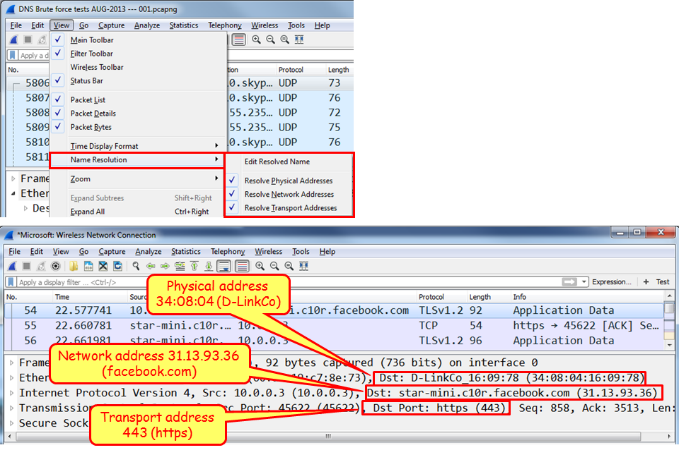
Name Resolution
In the screenshot, we see that the MAC address 34:08:04:16:09:78 (from D-Link), the website (that is, www.facebook.com), and the HTTPs port number (that is 443).
Note
The MAC address is the most simple translation: Wireshark look at the translation table (stored in .manuf file under the Wireshark directory). IP addresses are translated using DNS, and as described earlier in this chapter can cause some performance issues. TCP/UDP port numbers are stored in the Services file under the Wireshark directory.
Colorize packet list
Usually you start a capture in order to establish a baseline profile of what normal traffic looks like on your network. During the capture, you look at the captured data and you might find a TCP connection, IP, or Ethernet connectivity that are suspects, and you'll want to see them in another color.
To do so, right-click on the packet that belongs to the conversation you want to color, choose Ethernet, IP, or TCP/UDP (TCP or UDP will appear depending on the packet), and choose the color for the conversation.
In the example, you see that we want to color a TCP conversation.
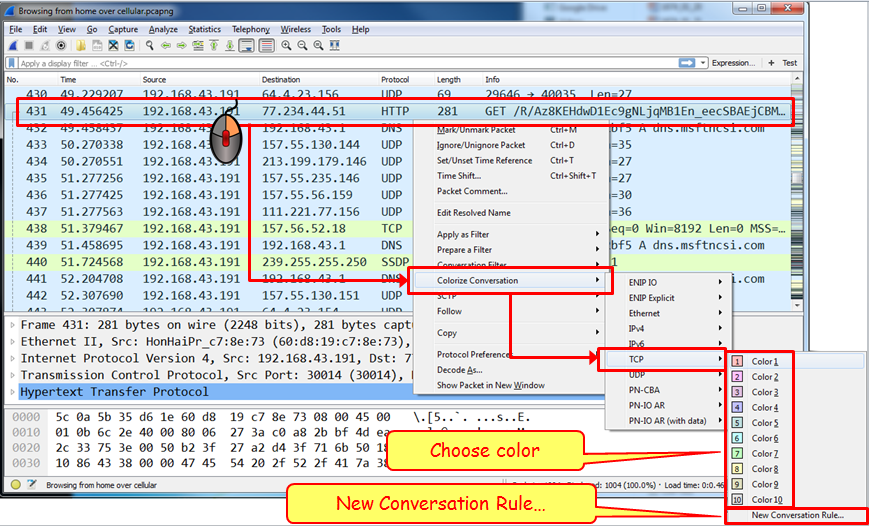
Colorize Conversation
To cancel the coloring rule:
- Go to the
Viewmenu - In the lower part of the menu, choose
Colorize Conversationand thenReset Colorizationor simply click on Ctrl + space bar
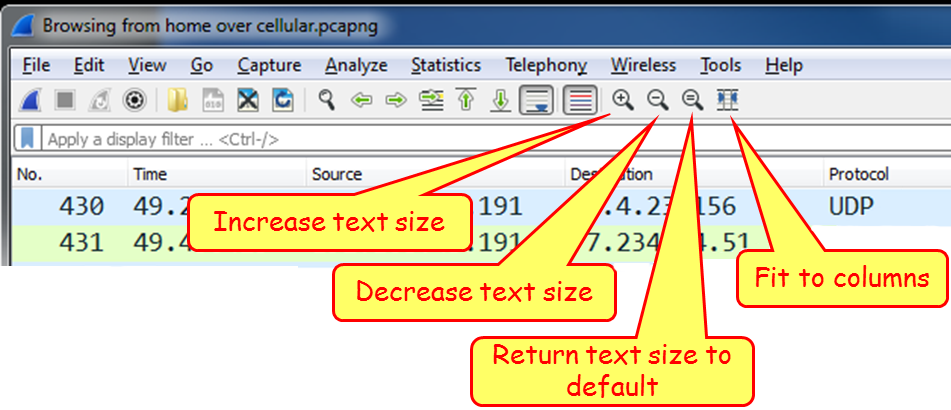
Zoom
As you see in the following screenshot, for zooming in and out:
- Go to the
Viewmenu - Click on
Zoom Inon the main toolbar or press Ctrl++ to zoom in - Click on
Zoom Outon the main toolbar or press Ctrl +- to zoom out