
Advanced I/O graph configurations with y axis parameters
In standard measurements using I/O graphs, we measure the performance of the network when the y axis is displayed in units of packets/second, bytes/second, or bits/second. There are some types of data that are not measured with these parameters—for example, cases where we measure the seconds between queries and responses, the seconds between Ethernet frames, delays, and other such cases that we will see in this recipe. These parameters are described in the next section. These capabilities are called Advanced in the y axis options in Wireshark version 1.
Getting ready
Open the drop-down menu under the y axis, as shown in the following screenshot:
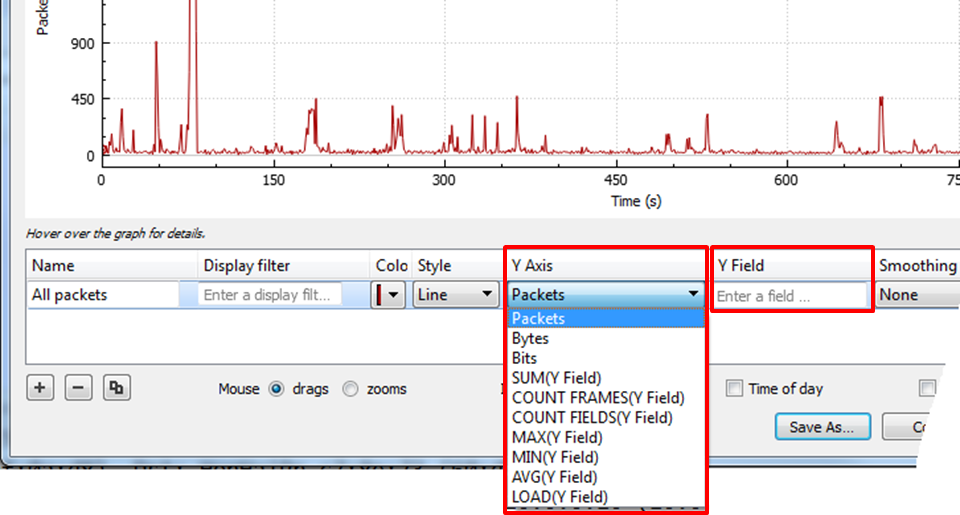
You will get the following options for the y axis:
SUM (Y Field): Draws a graph with the summary of a parameter in the tick intervalCOUNT FRAMES (Y Field): Draws a graph that counts the occurrence of the filtered frames in the time intervalCOUNT FIELDS (Y Field): Draws a graph that counts the occurrence...