Locale proof performance
One of the worst situations that can occur when we are working with microservices architecture is to put a code in production and see that the performance is poor. The work to bring the code back to the development environment, knowing that production in the project is compromised and the users are going through a bad experience, when it is something that could have been analyzed on the technical side, is extremely frustrating.
The problem now in production could have been predicted, and even solved in the development environment. To register this type of metric, there are many tools that can prove performance in the local environment.
Obviously, the local behavior will not perfectly reflect the production environment. There are many factors to be considered such as network latency, the machine where it was held for deployment and production, and communication with external tools. However, we can take local metrics to highlight a new algorithm or functionality that has compromised the overall performance of the application.
For local application metrics, there are some tools:
- Apache Benchmark
- WRK
- Locust
Each tool has specific features, but all serve the same purpose which is to get metrics about the endpoints.
Apache Benchmark
Apache Benchmark is better known as AB, and that's what we'll call it.
AB runs from the command line and is very useful to prove the speed and response of endpoints.
Running a local performance test is very simple, as can be seen in the following example:
$ ab -c 100 -n 10000 http://localhost:5000/The preceding command line invokes AB to run 10,000 requests (-n 10000), simulating 100 concurrent users (-c 100), and calling the local route in door 5,000 (http:// localhost: 5000/). The displayed result will be something like the following screenshot:
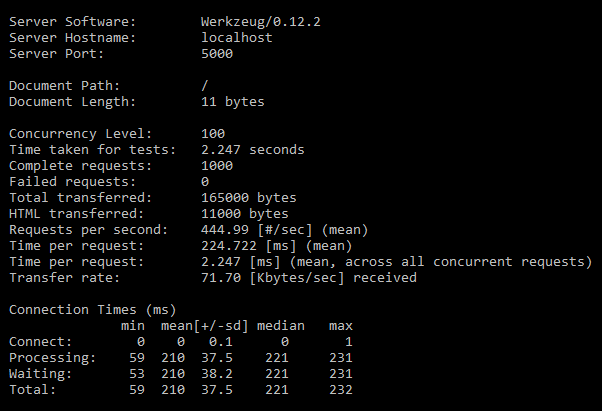
The result shows the server that performed the processing (Werzeug / 0.12.2), the hostname (localhost), the port (5000), and another set of information.
The most important data generated by AB is:
- Request per second: 444.99
- Time per request: 224.722 ms (mean)
- Time per request: 2.247 ms (mean, across all concurrent requests)
These three pieces of information at the end of the test process indicate the local application performance. As we can see in this case, the application used in this test returns 444.99 requests per second when you have 100 concurrent users and 10,000 charging requests.
Obviously, this is the most simple test scenario that can be done with AB. The tool has a number of other features, such as exporting graphics performance tests performed, and simulating all the verbs that the REST API can run on HTTPS certificates and simulate. These are only a few other attributes that AB offers as a resource.
WRK
Similar to AB, the WRK is also a tool executed by the command line and serves the same purpose as the AB. The following screenshot represents the WRK tool:
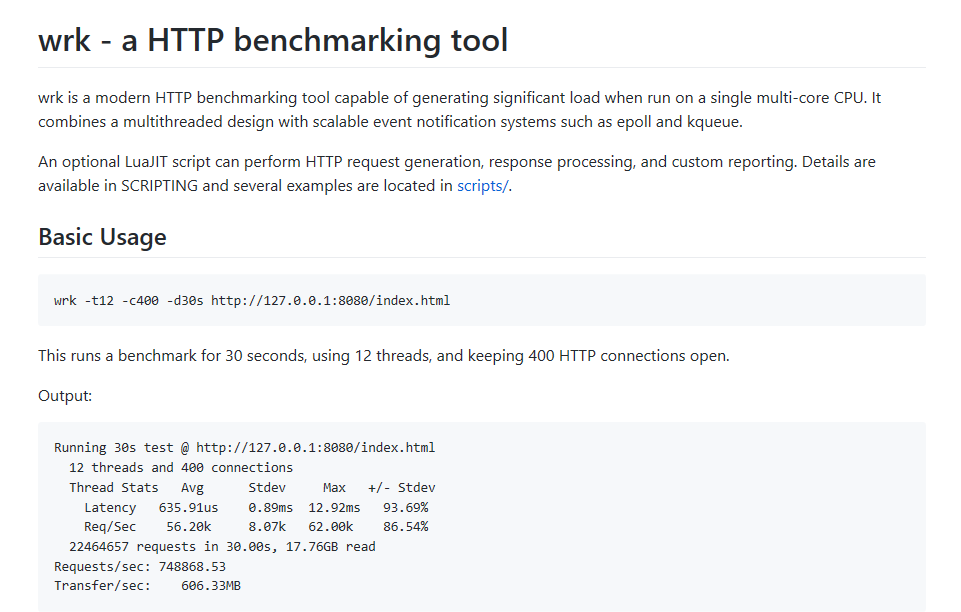
To run WRK is also very simple. Just use the following command:
$ wrk -c 100 -d 10 -t 4 http://localhost:5000/However, WRK has some different characteristics compared to AB. The preceding command means that WRK will run a performance test for ten seconds (d 10), with 100 concurrent users (c 100), and will request four threads from the operating system for this task (-t 4).
Quickly observing the command line, it can be perceived that there is no limitation or requests load statement to be executed; WRK does not work that way. The WRK test proposed is to perform load stress for a period of time.
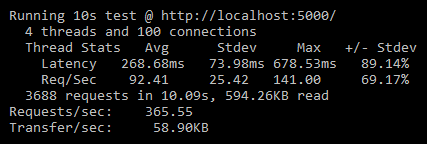
Ten seconds after executing the command line that is a little higher, WRK will return the information, shown in the following screenshot:
Clearly, the returned data is more concise. But suffice to know that the behavior before a temporal change is made to our application.
Again, it is good to point out the local test feature and not necessarily the result of WRK is evidence that reflects the reality of an application in production. However, WRK offers good numbers to have a metric of application.
From the data generated by WRK, we can see that after the 10 seconds test with a 100 concurrent users and using four threads, our application in the local environment has the following numbers:
- Requests/sec:
365.55 268.68mslatency (mean)
The WRK figures are somewhat lower than those provided by AB; this is clearly the result of the test performed by each type of tool.
WRK is very flexible for running tests, including accepting the use of scripts in the Lua programming language to perform some specific tasks.
WRK is one of my favorite tools for local performance tests. The type of test performed by WRK is very close to reality and offers numbers very close to actual results.
Locust
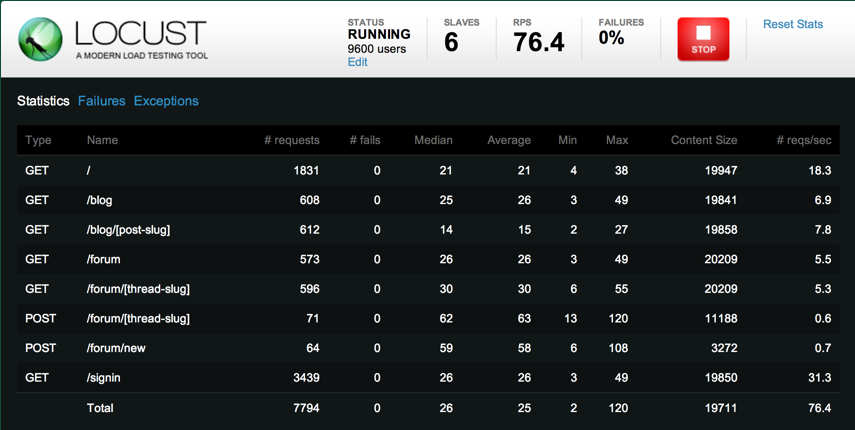
Out of the tools listed as an example for local metrics APIs, Locust has only one visual interface. Another interesting feature is the possibility to prove to multiple endpoints simultaneously.
The Locust's interface is very simple and easy to understand. You can tell how many concurrent users will soon be used in the interface data input. After the start of the process with Locust, the iron fist begins to show the GUI HTTP verb used, the path where the request was directed, the number of requests made during the test, and a series number for the metrics collected from multiple websites.
The GUI can be seen in detail in the following screenshot:
Using the Locust is very simple. The first step is the installation. Unlike AB and WRK, the installation of Locust is done through pypi, the Python installation package. Use the following command:
$ pip install locustioAfter installation, you must create a configuration file called locustfile.py with the following contents:
# import all necessary modules to run the Locust:
 from locust import HttpLocust, TaskSet, task

    # create a class with TaskSet as inheritance
    class WebsiteTasks(TaskSet):

    # Create all the tasks that will be metrify using the @taks decorator
    @task
    # the name function will be the endpoint name in the Locust
    def index(self):
        # set to the client the application path with the HTTP
           verb        # in this case "get"
        self.client.get("/")

        @task
        def about(self):
          self.client.get("/about/")

    # create a class setting the main task end the time wait for each request
      class WebsiteUser(HttpLocust):
       task_set = WebsiteTasks
       min_wait = 5000
       max_wait = 15000
After the configuration file is created, it is time to run Locust. To do this, it is necessary to use the following command line:
$ locust -f locustfile.pyLocust will provide a URL to access the visual interface. Then the metrics can be verified.
Initially, Locust's configuration may seem more complex than the other applications shown in this section. However, after the initial process, the course of the test is very simple. As in AB and WRK, Locust has many features for deeper testing.