
Fail alert tools
Just as we prepare our product to be successful, we must also prepare for failures. There is nothing worse in microservices than silent errors. Receiving faulty alerts as soon as possible is critical, which is considered to be a healthy microservices ecosystem.
There are at least four major points of failure when it comes to microservices. If these points are covered, we can say that about 70% of the application is safe. These points are as follows:
- Performance
- Build
- Components
- Implementation failures
Let's understand what each of these risk points are and how we can receive failure alerts as soon as possible.
Performance
Let's look a little further at some very interesting tools to prove the performance of our endpoints. Local test endpoints help to anticipate performance issues that we would only see in production.
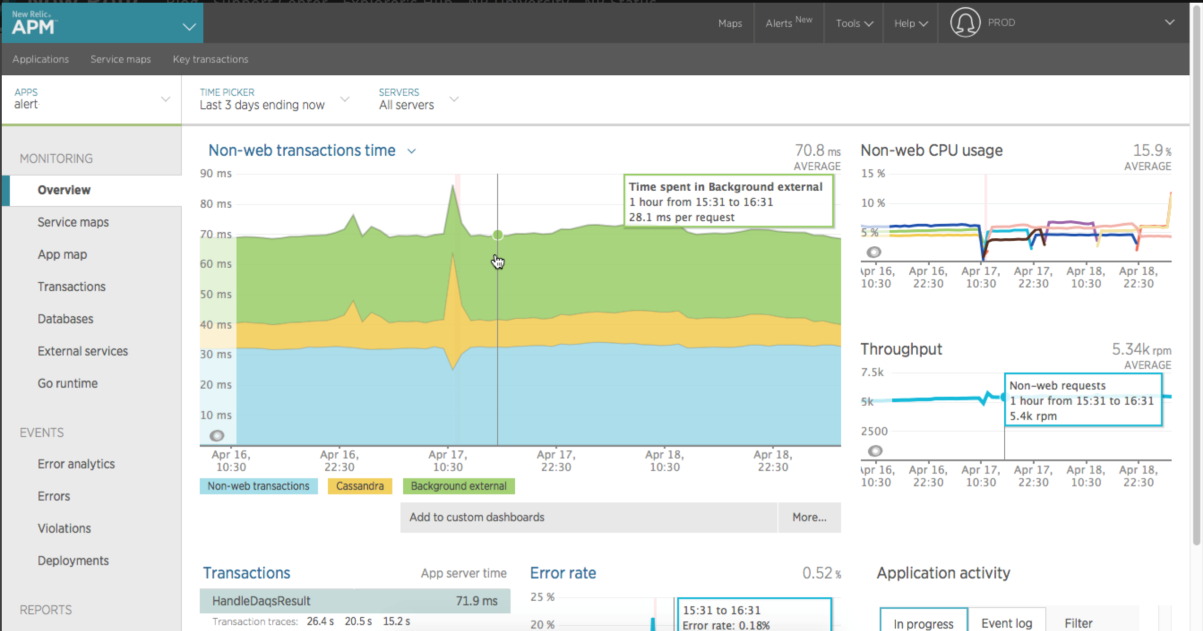
After sending the microservices to the production environment, some tools can be used to monitor the implementation of the performance as a whole. There are both free, as well as paid tools, and some very effective tools like New Relic and Datadog. Both are very simple to implement and have a dashboard rich in information:
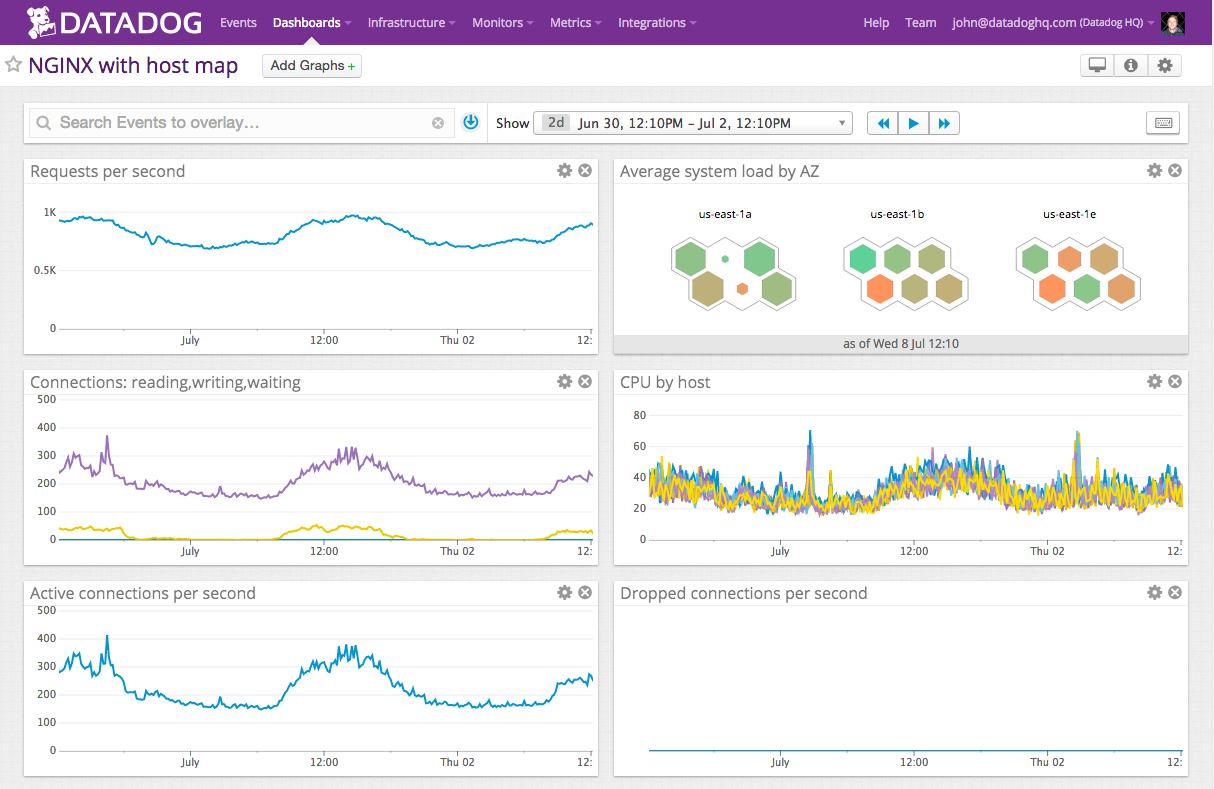
The following screenshot represents the interface of DATADOG:
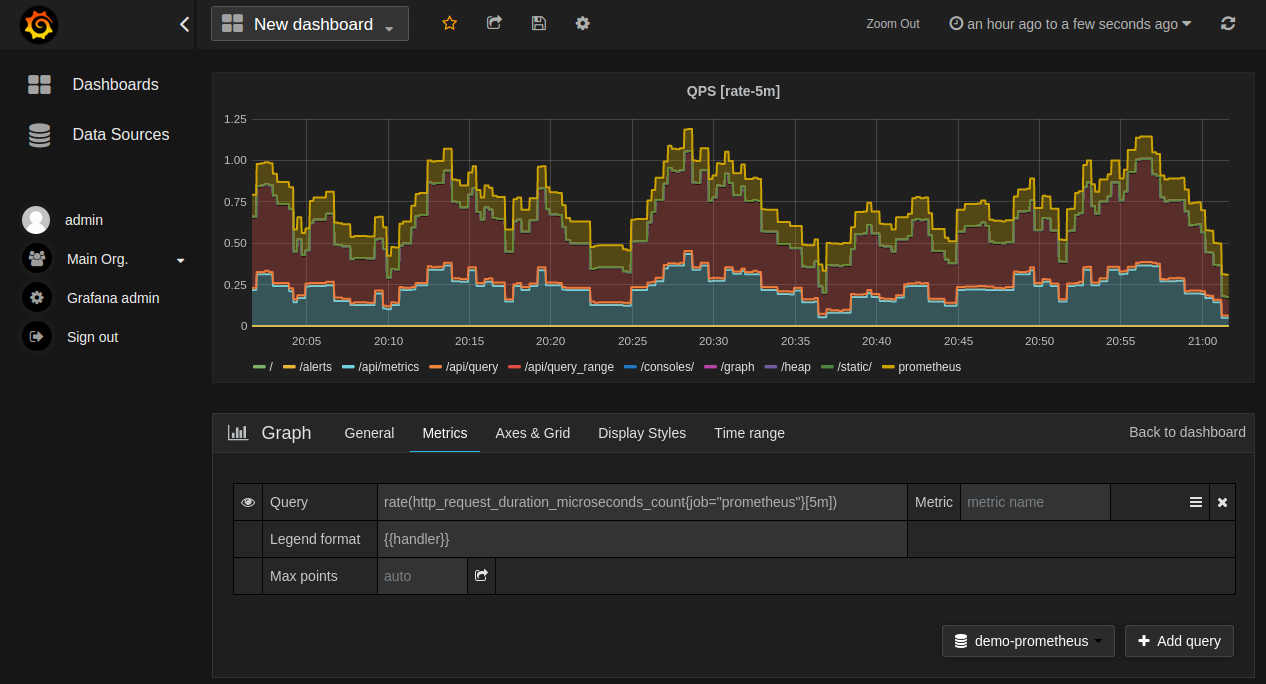
Obviously, there are options for performance monitoring that are totally free, as we have the traditional Graphite with Grafana and Prometheus. The free options require more settings than those mentioned previously to provide similar results.
From the free options, Prometheus deserves a special mention because of its wealth of information and practical implementation. Along with Graphite, Prometheus also integrates with Grafana for displaying graphics performance. The following screenshot represents the use of Prometheus:
Build
This is a very important point because this is the last step in which a failure can be located without affecting the end user. One of the pillars of microservices architecture is processing automation. To build and deploy is no different.
The time to build is usually the last stage before moving the application to a particular environment, a quality environment, or stage production.
In microservices, all must have high coverage for unit testing, functional testing, and integration testing. It seems obvious to say, but many development teams do not end up paying too much attention to automated testing and suffer for it later.
To automate the application build process, and consequently, the application deployment, is fundamentally a good continuous integration tool or CI. In this respect, one of the most mature, complete, and efficient tools is Jenkins. Jenkins is a free and open source project. It is extremely configurable, being able to fully automate processes.
There are other options like Travis. Travis works online with a CI and is completely free for open source projects. Something interesting in Travis, is the great compatibility that it has with GitHub.
The most important factor of working with a CI is properly setting up the application testing process, because, as has been said before, this is the last stage to capture failures before affecting the end user of our product. The CI is the best place for the integration of microservices tests.
Components
The strong characteristic of microservices architecture is the large number of components that can fail. Containers, databases, caches, and message brokers serve as examples of failure points.
Imagine the scenario where the application begins to fail, simply because the hard drive of a database is faulty in some physical component. The time of action in applications where there is no monitoring for this type of problem is usually high because normally the application and the development and support teams always start investigating failures on the software side. Only after confirming that the fault is not in the software do teams seek problems in physical components.
There are tools like pens-sentinel to provide more resilience to the pens, but not all the physical components have that kind of support.
A simple solution is to create a health check endpoint within each microservice. This endpoint is not only responsible for validating the microservice instance, whether it is running, but also all the components that the microservice is connected to. Tools like Nagios and Zabbix are also very useful for making aid work to health check endpoints.
Implementation gaps
In some cases, automated tests may not have been well written and do not cover all cases, or some external component, such as an API vendor, starts throwing errors in the application.
Often these errors are silent, and we only realize after a user reports the error. But questions remain as to how many users have experienced this error and not reported it. What value loss level mistake did the product have?
These questions have no answers and are almost impossible to quantify. To capture this kind of problem as quickly as possible all the time, we need to monitor the internal failures of the application.
For this type of monitoring, there are a number of tools, but the more prominent is Sentry. Sentry has very interesting features:
- See the impact of new deployments in real time
- Provide support to specific users interrupted by an error
- Detect and thwart fraud as it's attempted: unusual amounts of failures on purchases, authentication, and other critical areas
- External integrations
Sentry has a cost and unfortunately, there is no free option that is effective.
With the four fault points covered by warning systems, we are safe to continue with our development and put into production our microservices with the automated and continuous process.