


K-means cluster analysis example
The example data includes 272 observations on two variables--eruption time in minutes and waiting time for the next eruption in minutes--for the Old Faithful geyser in Yellowstone National Park, Wyoming, USA. This data is available in many places, including the freeware R program.
Note
An original source is Hardle, W. (1991) Smoothing Techniques with Implementation in S. New York: Springer.
One reason that this data is featured in examples is that charts reveal that the observations on each input are clearly bimodal. For this reason, we use them to illustrate K-means clustering with two clusters specified.
Our analysis proceeds as usual:
- Descriptive analysis
- Cluster analysis
- Cluster profiling
Descriptive analysis
Here is a histogram of eruption:
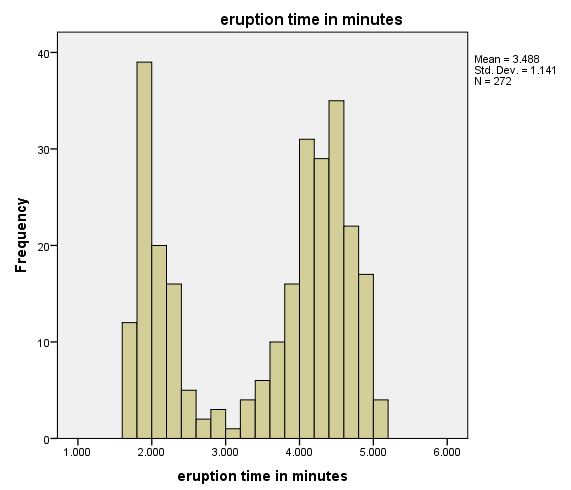
You can clearly see the bimodal nature of the distribution, with one center around 2 and another center around 4.5.
Here is a histogram of the waiting time to next eruption:
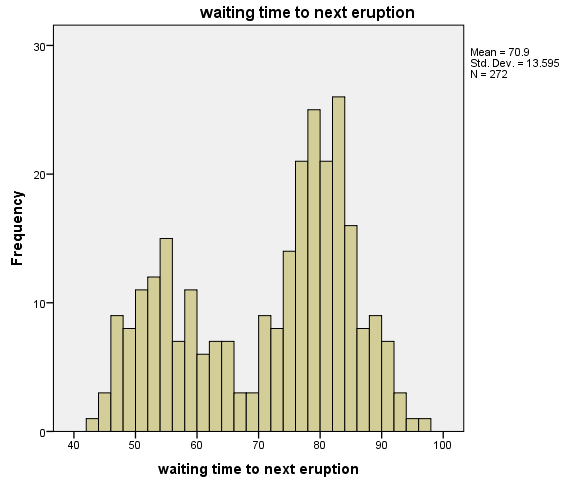
Again, you can clearly see the bimodal nature of the...


