


Data visualized using a pack layout
Another way to visualize the same data is by using circles. The code, once again, looks pretty much the same as the previous examples. This time, however, we create circle elements based on a provided radius, instead of rectangle elements:
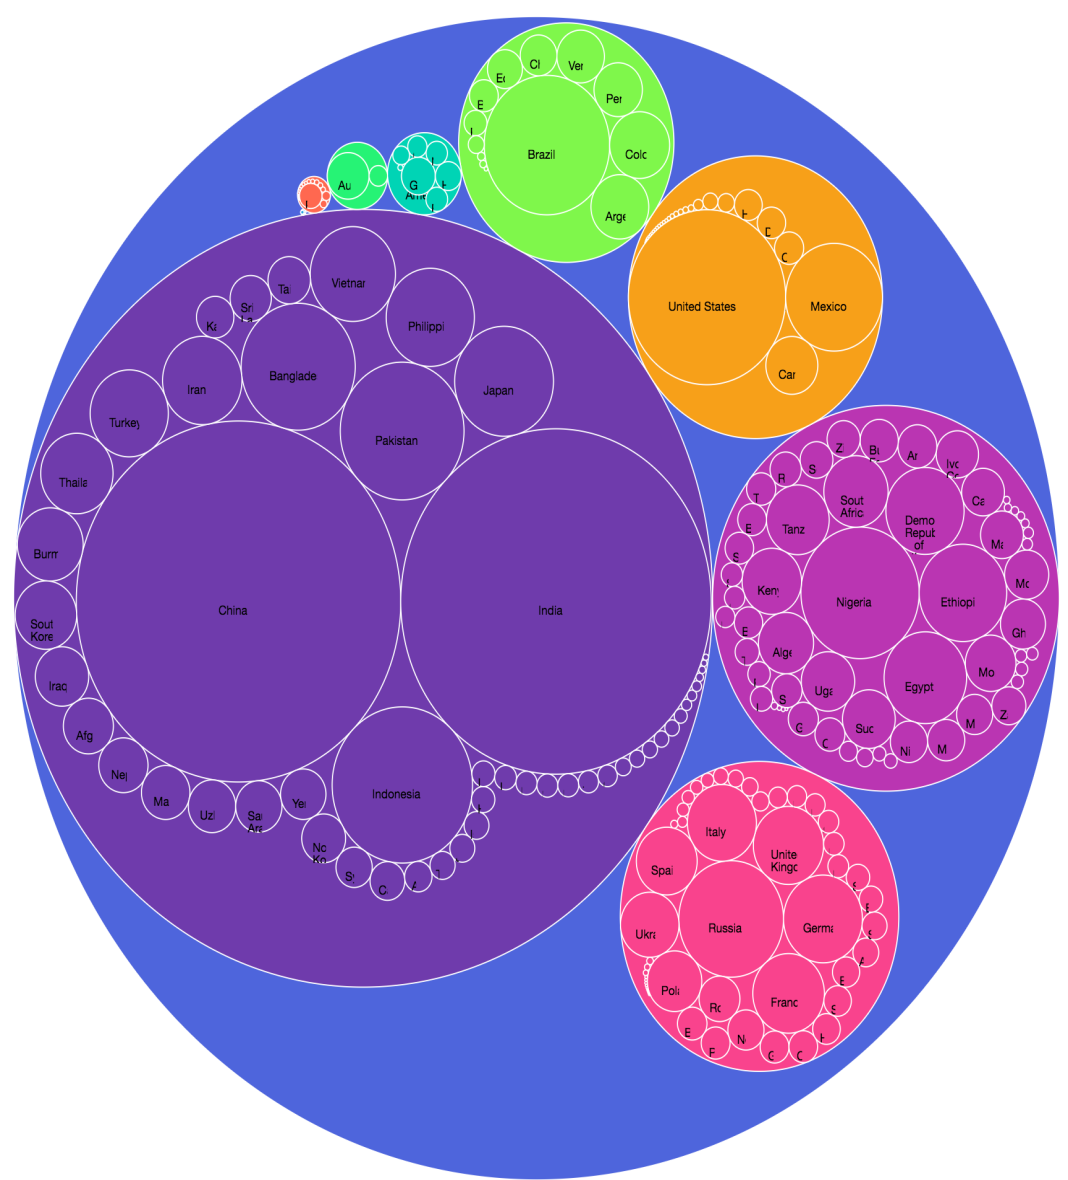
We won't go into the details here on how to use this layout type. If you want to explore this example further, look at the DVD3/chapter-03/D03-05.js file.


