


Heart rate and respiratory monitoring
For this example, we're going to show data pushed from a backend server. Specifically, we're going to visualize heart rate and respiratory data which is pushed over a WebSocket to our D3 frontend.
We're going to recreate the following visualization (the DVD3/src/chapter-06/D06-02.html example):
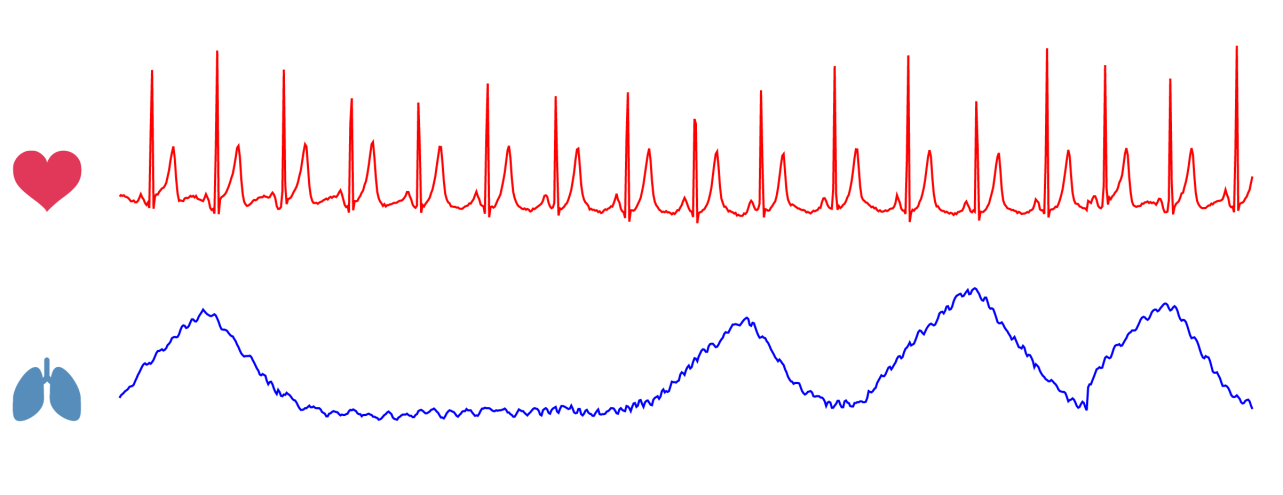
To get this example up and running, we're going to take the following steps:
- Get sample respiratory data which we can push to the frontend.
- Create a simple WebSocket server, which pushes the information.
- Make the D3 visualization which responds to information pushed from the server.
We start with the sample data.
Getting the sample data
PhysioNet is an online research platform which provides free access to a large number of recorded physiological signals. One of the datasets is called the Fantasia Database. The description online best describes this data source:
"Twenty young (21 - 34 years old) and twenty elderly (68 - 85 years old) rigorously-screened healthy subjects...


