


Generative art with nested Voronoi diagrams
Besides using Voronoi diagrams based on real data, we can also make a Voronoi of random data, like we did in the beginning of this chapter. Using this approach, we saw that you can quickly create nice-looking diagrams. In this section, we'll go one step further and create additional Voronoi diagrams inside the cells of an existing Voronoi diagram. If we do this a couple of times, we get a nice nested Voronoi diagram:
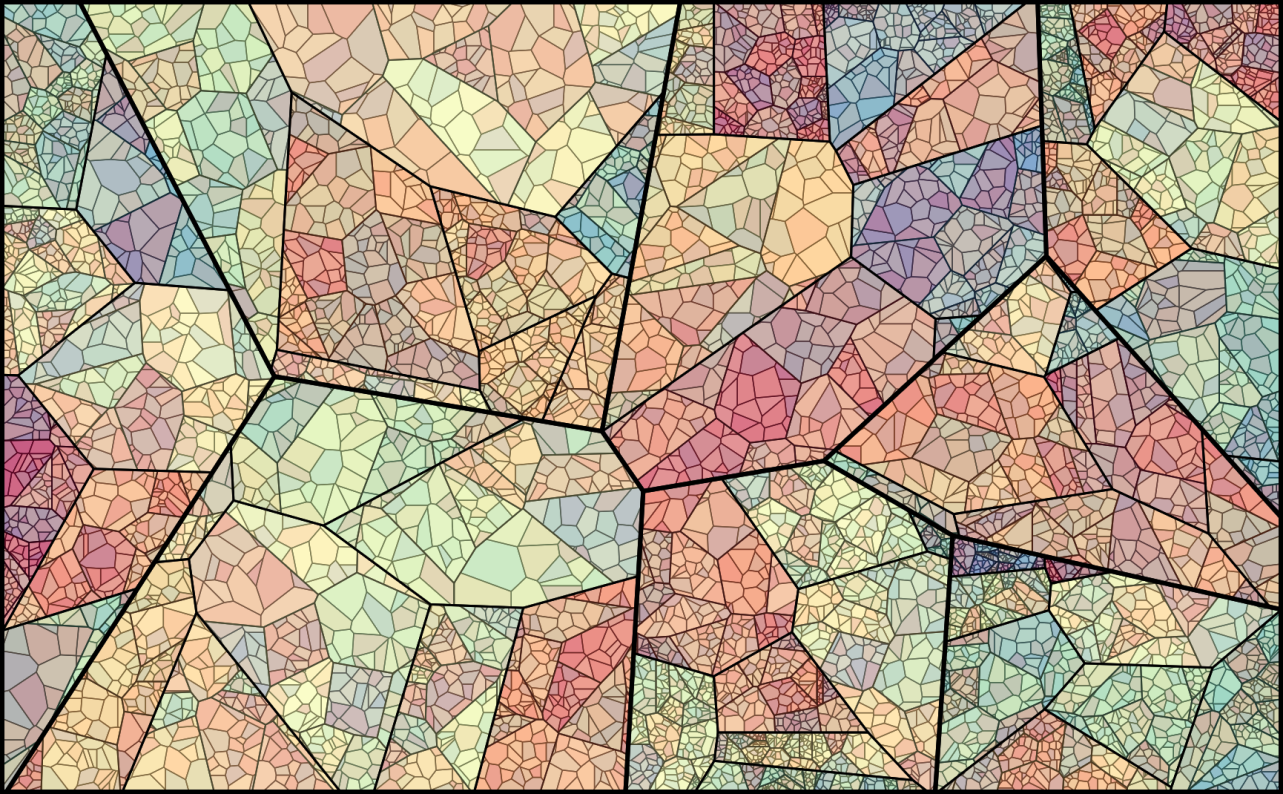
What you can see here is that each Voronoi cell itself is divided into more Voronoi cells, and these smaller cells themselves are divided once again. The result is a very nice-looking nested diagram.
In this section, we'll walk through the code to create this diagram.
Set up the Voronoi
The first thing we need to do is set up the area where we render the complete Voronoi diagram. This is a standard setup:
var pointSeed = 8;

// Generic setup
var margin = {top: 50, bottom: 20, right: 20, left: 20},
    width = 1200 - margin.left - margin...


