


Rotating the world globe
For this example, we're going to create the following visualization (see DVD3/src/chapter05/D05-03.html):
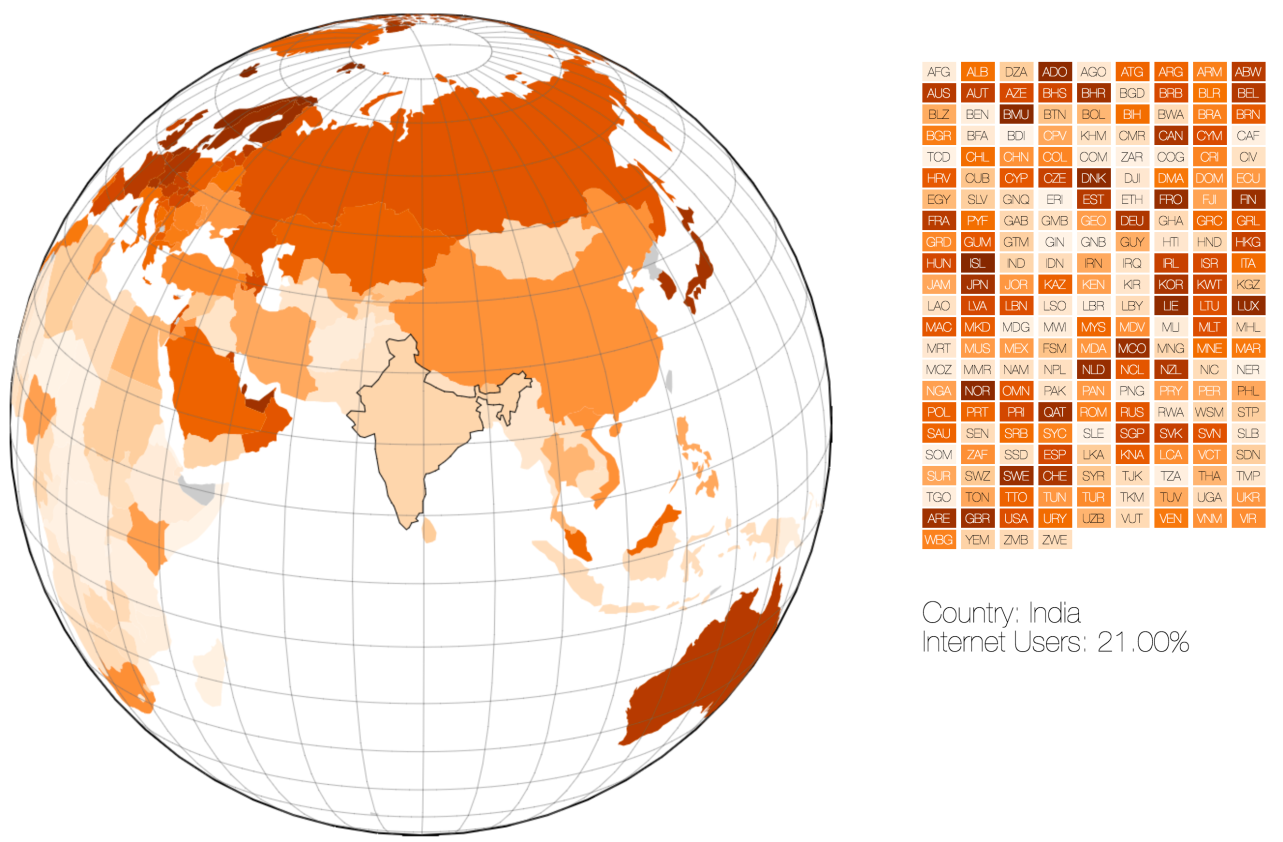
In this visualization, we show the percentage of adults who are using the iUnternet. You can rotate the globe with your mouse, and when you click one of the countries on the right side, the map will automatically rotate to that specific country. Let's start by looking at the data that we'll use for this sample.
Getting and sanitize the data
For the topography world data, we're going to use the same source as we did in the previous visualization. Before we look at the other sources, let's look a bit closer at this one (https://d3js.org/world-110m.v1.json):
{"type":"Topology","objects":{"countries":{"type":"GeometryCollection","geometries":[{"type":"Polygon","id":"004","arc ... This is part of the first line of this geometry file. As we've seen in the previous example, we can use this to draw countries using a specific projection. Besides just the shape of the country...


