


Heatmap offers two-dimensional grid representation. The individual cell of the grid contains a value of the matrix. The heatmap function also offers annotation on each cell:
# Import required library
import seaborn as sns

# Read iris data using load_dataset() function
data = sns.load_dataset("iris")

# Find correlation
cor_matrix=data.corr()

# Create heatmap
sns.heatmap(cor_matrix, annot=True)

# Show figure
plt.show()
This results in the following output:
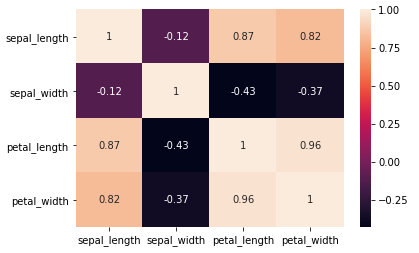
In the preceding example, the Iris dataset is loaded using load_dataset() and the correlation is calculated using the corr() function. The corr() function returns the correlation matrix. This correlation matrix is plotted using the heatmap() function for the grid view of the correlation matrix. It takes two parameters: the correlation matrix and annot. The annot parameter is passed as True. In the plot, we can see a symmetric matrix, and all the values on the diagonal are ones, which indicates a perfect correlation of...


