


Bokeh uses a visual glyph, which refers to the circles, lines, triangles, squares, bars, diamonds, and other shape graphs. The glyph is a unique symbol that is used to convey information in pictorial form. Let's create a line plot using the line() function:
# Import the required modules
from bokeh.plotting import figure, output_notebook, show

# Import the required modules
from bokeh.plotting import figure
from bokeh.plotting import output_notebook
from bokeh.plotting import show

# Create the data
x_values = [1,3,5,7,9,11]
y_values = [10,25,35,33,41,59]

# Output to notebook
output_notebook()

# Instantiate a figure
p = figure(plot_width = 500, plot_height = 350)

# create a line plot
p.line(x_values, y_values, line_width = 1, color = "blue")

# Show the plot
show(p)
This results in the following output:
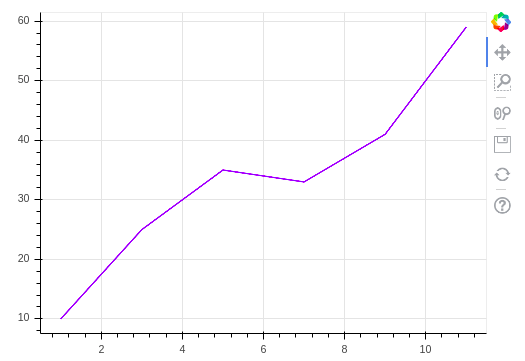
In the preceding example, the line() function takes the x- and y-axis values. It also takes the line_width and color values of the line. In the next section, we will focus on the...


