


Monitoring Kubernetes
Stackdriver is GCP’s comprehensive monitoring, logging, and alerting product. It can be used to monitor Kubernetes clusters.
When creating a cluster, be sure to enable Stackdriver monitoring and logging by selecting Advanced Options in the Create Cluster form in Cloud Console. Under Additional Features, choose Enable Logging Service and Enable Monitoring Service, as shown in Figure 7.10.
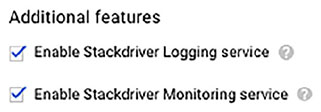
FIGURE 7.10 Expanding the Advanced Options in the Create Cluster dialog will show two check boxes for enabling Stackdriver logging and monitoring.
To set up Stackdriver from Cloud Console, select Stackdriver from the top-level menu on the left. Initially, you will need to create a workspace in your project by selecting a new workspace and launching monitoring when prompted (see Figure 7.12). Once a workspace is created, you can monitor your GCP resources, including Kubernetes clusters.
Workspaces are resources for monitoring and can support up to 100 monitored projects...


