
Velocity chart
In this section, we're going to talk about the velocity chart. The velocity chart is very valuable. First, we'll talk about what it is, how to read it, and then we're going to talk about how to use our past velocity to plan our future commitments.
Velocity chart example
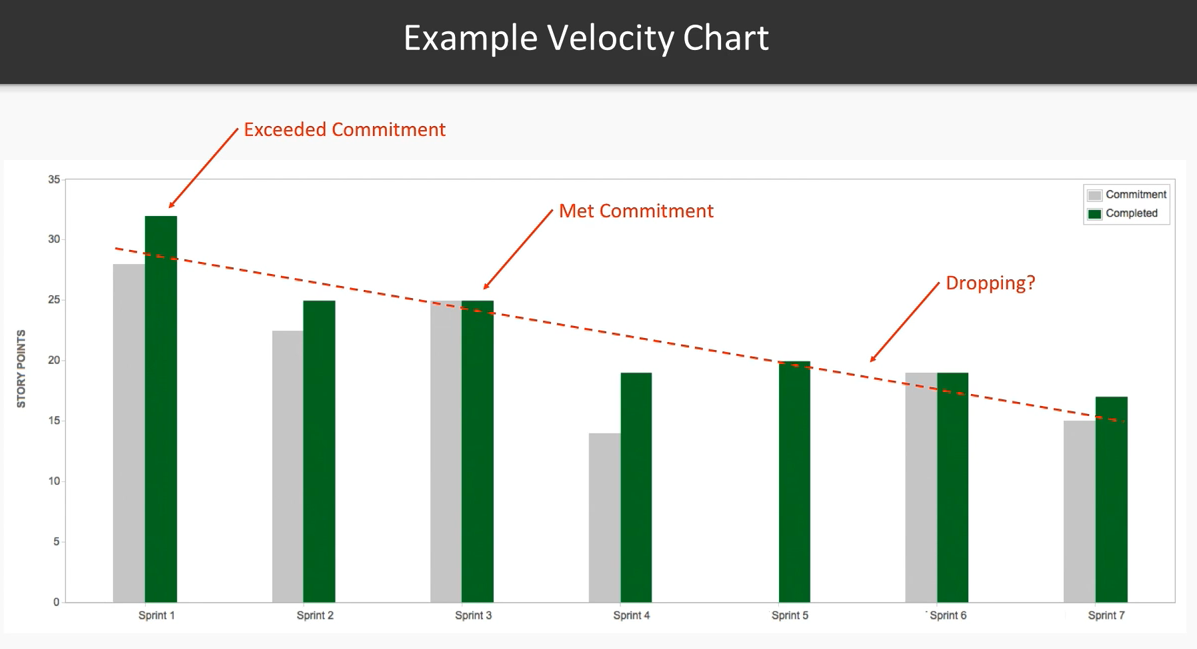
Let's take a look at an example of a velocity chart:
Velocity chart
To orient us to the preceding chart, let's take a look at the different elements. The gray bars represent what we've committed to in our Sprint, and we can see that this is measured in Story Points. In this example, we can see that in Sprint 3, we've actually committed to 25 story points. The green bar represents what people created, and so we've completed 25 story points, and we've met 100 percent of our commitment. That's great! We can also see some examples where the gray bar is lower than the green bar, which means we've committed, but we've actually completed even more than we committed, which is even better.
If we look at Sprint 5, it doesn...