


Earthquake data on a flat map
For this example, we're going to plot earthquake data on a map. This visualization will have the following features:
- A slider at the bottom can be used to select the year to be shown.
- A dropdown at the top allows you to switch between projections.
- A map in the center shows the projections and the earthquake data plotted on top.
An example using the Robinson projection looks like this:
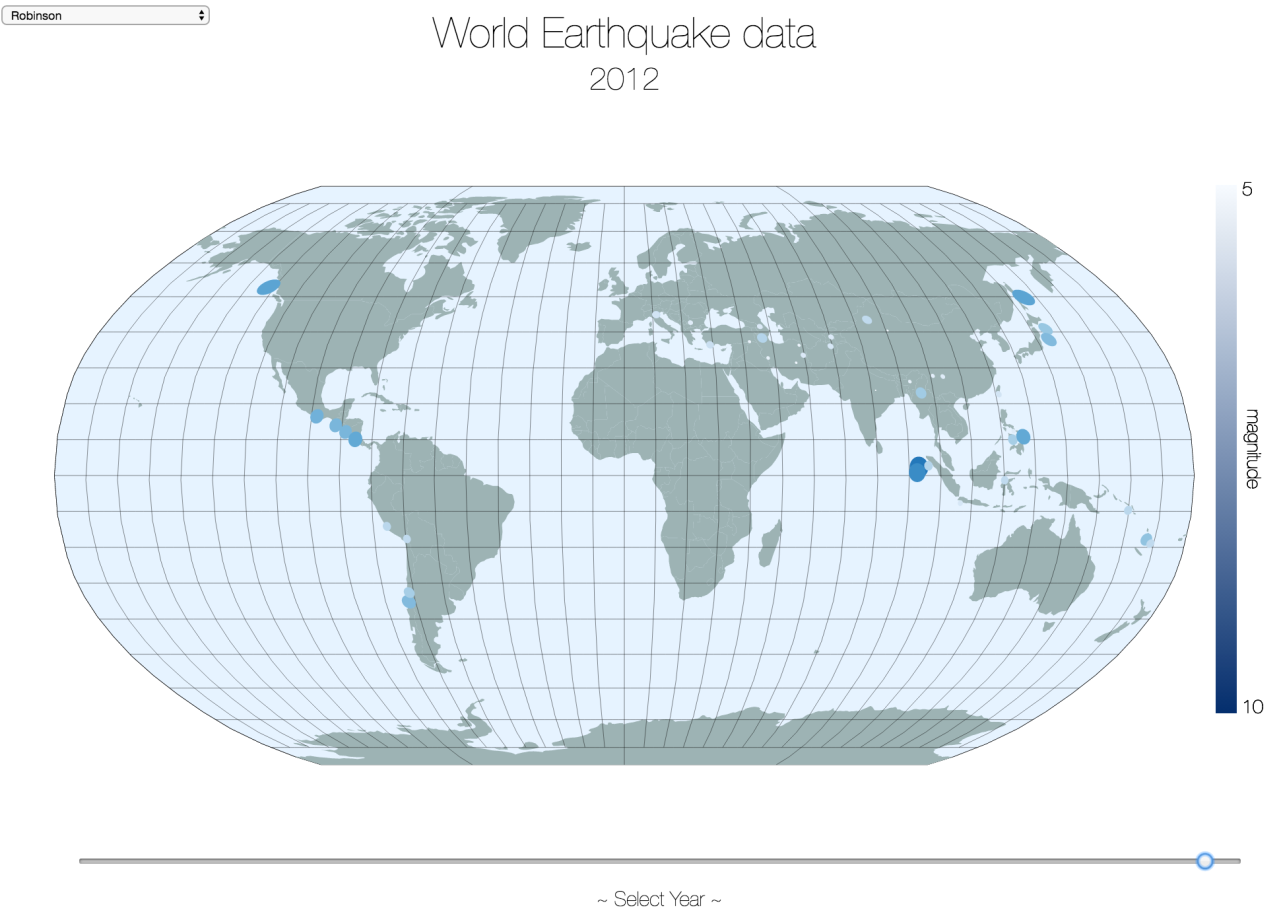
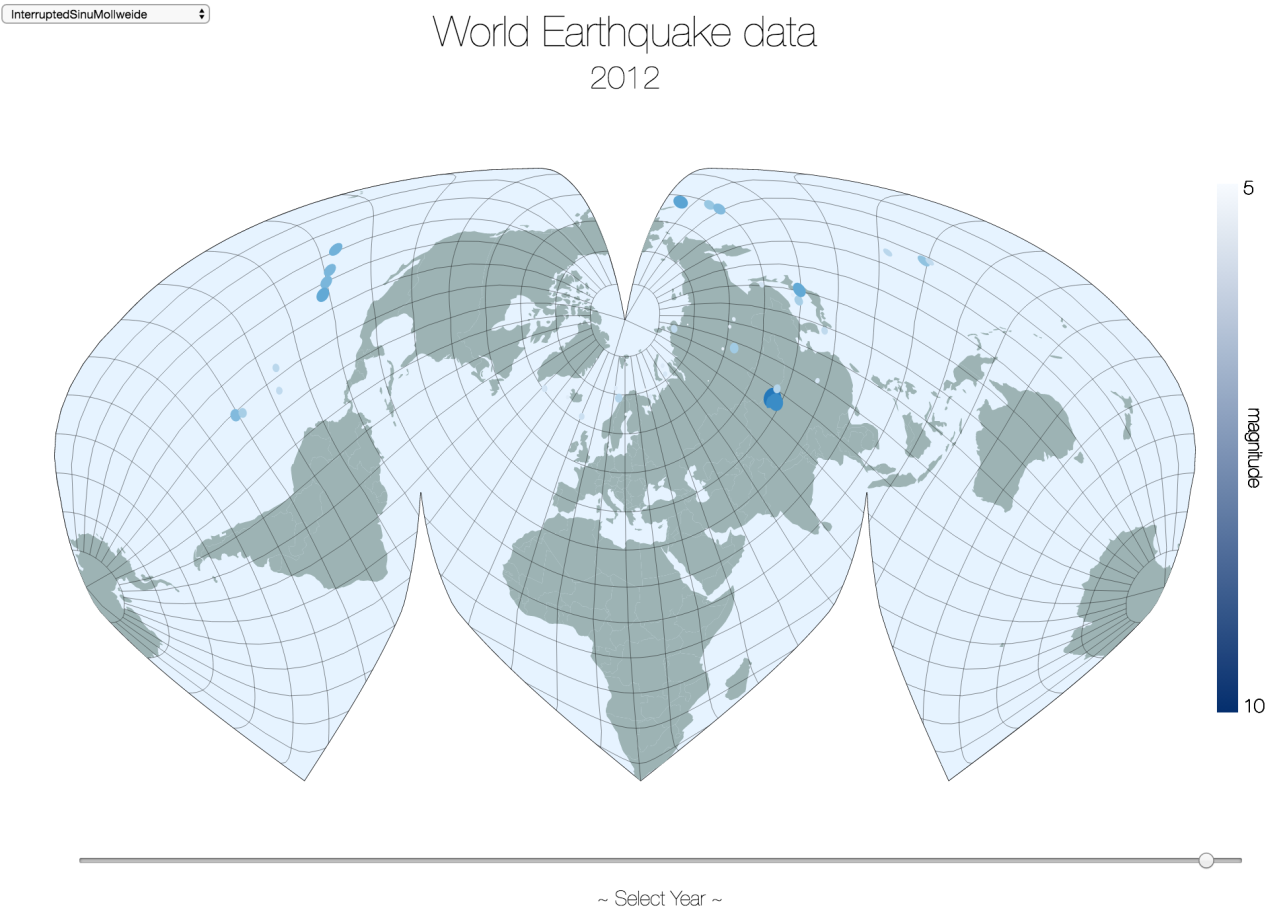
This is a fairly standard projection, but D3 also comes with a number of more interesting projections. For instance, the InterruptedSinuMollweide projection renders the same information like this:
First, as we do for all the examples, we'll show you how to get the data.
Getting the data
For this example, we use two different data sources. First we use a TopoJSON map of the world, which we use to draw the map. This time we'll use information from the TopoJSON world atlas project (https://github.com/topojson/world-atlas), which provides pre-built TopoJSON files. For our example we use the...


