


Elections 2016 choropleth
For our first example, we're going to create an election map for the 2016 presidential election. In this map, we'll color the results of each individual county based on whether they voted democrat or republican. The map we create will look like this:
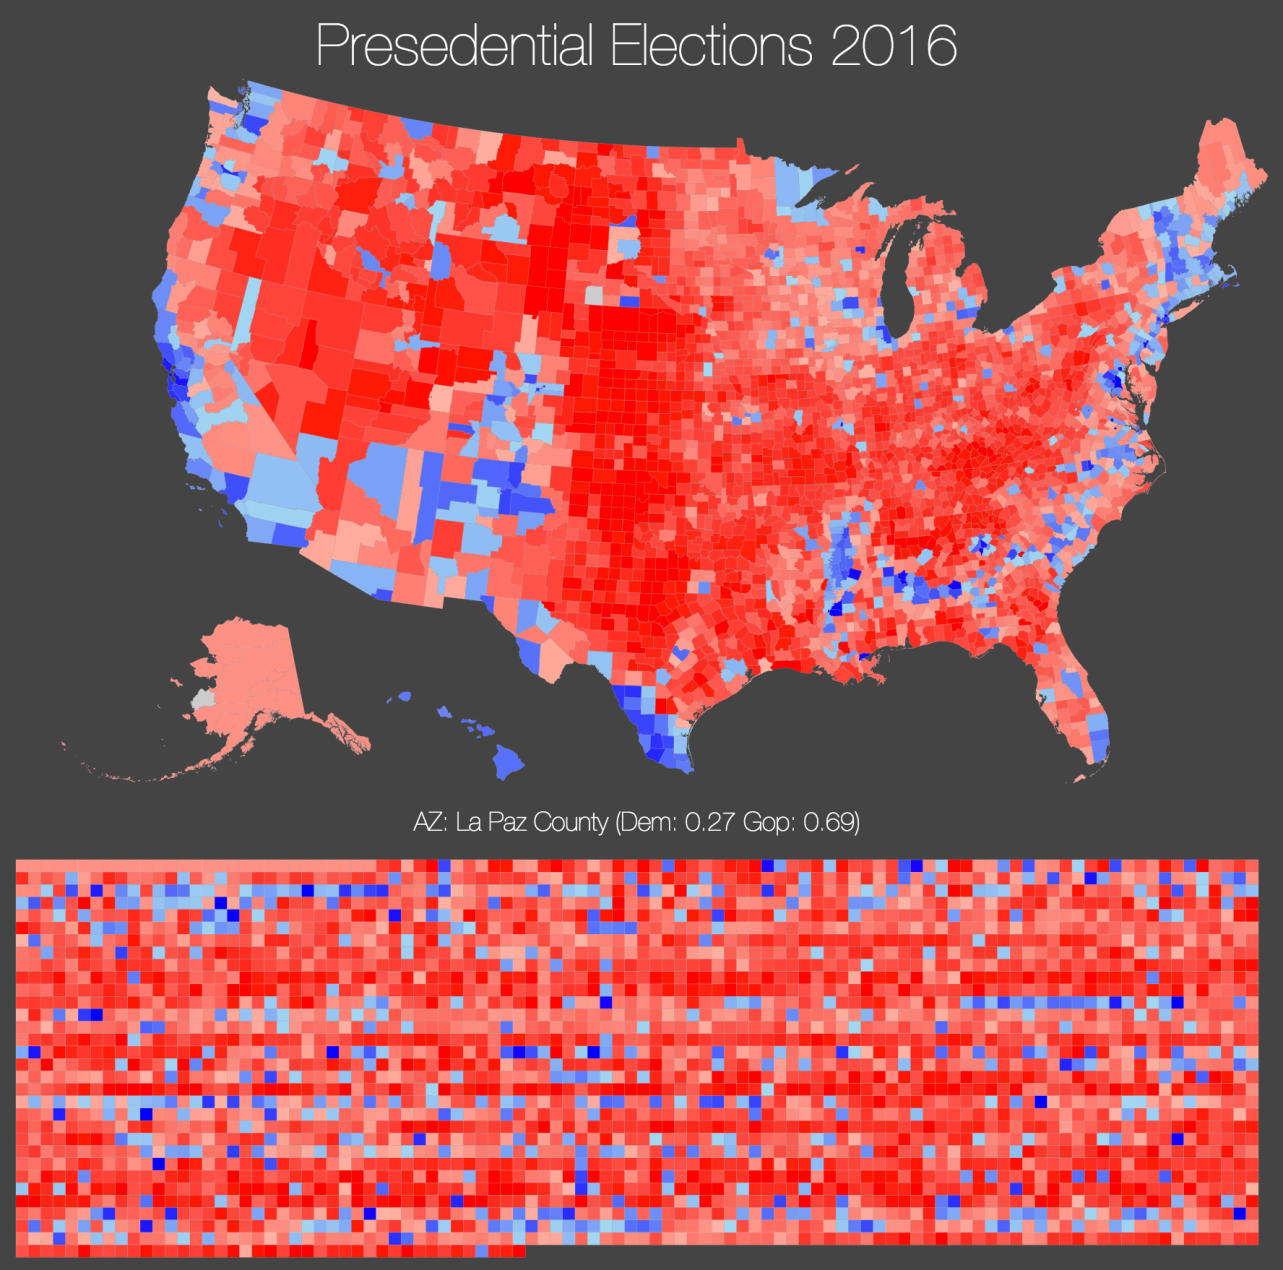
Additionally, we'll also show a list of small cubes below the map that show the results of the individual counties. These counties are ordered per state (as they already appear like that in our source data). Before we can do all this, we first need to collect the data, and prepare it for use in D3.
Preparing data
As we'll see in this chapter, when working with geo-related data, a lot of time is spent on preparing the data, and representing it is rather straightforward. For this first example where we're going to create an election map, we first need to get create a JSON file containing the geometries for all the individual states, counties and districts.
To get those geometries in the correct format, we're going to take...


