


How does D3 work?
At this point, you should have a working environment, so let's start by looking at some code and see if we can get D3 up and running. As we've mentioned at the beginning of this chapter, D3 is most often used to create and manipulate SVG elements using a data-driven approach. SVG elements can represent shapes, lines, and also allow for grouping. If you need a reference to check what attributes are available for a specific SVG element, the Mozilla Developer Network also has an excellent page on that: https://developer.mozilla.org/en-US/docs/Web/SVG.
In this section, we'll perform the following steps:
- Create and add an empty SVG group (
g) element, to which we'll add our data elements. - Use a JavaScript array that contains some sample data to add rectangles to the
SVGelement created in the previous step. - Show how changes in the data can be used to update the drawn rectangles.
- Explain how to handle added and removed data elements using D3.
At the end of these steps, you should have a decent idea of how D3 binds data to elements, and how you can update the bound data.
Creating a group element
The first thing we need to do is create a g element to which we can add our own elements. Since we're visualizing data using SVG, we need to create this element inside the root SVG element we defined in our HTML skeleton in the previous section. We do this in the following manner:
function show() {

    var margin = { top: 20, bottom: 20, right: 40, left: 40 },
        width = 400 - margin.left - margin.right,
        height = 400 - margin.top - margin.bottom;

    var chart = d3.select(".chart")
        .attr("width", width + margin.left + margin.right)
        .attr("height", height + margin.top + margin.bottom)
        .append("g")
        .attr("transform", "translate(" + margin.left + "," + margin.top + ")");
}
In this code fragment, we see the first usage of the D3 API. We use d3.select to search for the first element with the class chart. This will find the SVG element we defined in our HTML template (<svg class="chart"></svg>), and this will allow us to modify that element. D3 uses a W3C Selectors API string to select elements (more information here: https://www.w3.org/TR/selectors-api/). Summarizing this means that you can use the same kind of selector strings that are also used in CSS to select specific elements:
.className: selects the elements that have a class with the nameclassName..elemName: selects the elements of typeelemName#id: selects the element that has an attributeidwith a valueid..className1 .className2: selects all elements with the class name.className2which are descendants from the element with class name.className2
Note
A lot more options are available: a good overview can be found here: https://www.w3.org/TR/CSS21/selector.html
Now that we have the SVG element, we use the attr function to set its width and height, leaving a bit of margin at all sides. Finally, we add the g element using the append function and position that element by taking into account the margins we defined by setting the transform attribute. D3 has a fluent API which means we can just chain commands and functions together (as you can see in the previous code fragment). This also means that the result of the final operation is assigned to the chart variable. So in this case, the chart variable is the g element we appended to the svg element.
A g element isn't rendered when you add it to a SVG element. The g element is just a container in which you can add other elements. The most useful part of the g element is that all of the transformations applied to this element are also applied to the children. So if you move the g element, the children will move as well. Additionally, all the attributes defined on this element are inherited by its children.
This might seem like a lot of work to just get an empty group to add elements to, but it is good practice to use a setup like this. Using margins allows us to more easily add axes or legends later on, without having to reposition everything and having a clear and well defined height and weight allows us to use other D3 features (such as scales) to correctly position elements, as we'll see later in this chapter.
At this point, it's also a good point to explain the transform attribute we use to position the g element inside the svg element. The transform attribute allows a couple of operations we can use to change the position and rotation of any SVG elements (such as g, text, rect). You'll see it used throughout this book, since it is the standard way to position SVG elements. The following table shows what can be done with the transform attribute:
Operation | Description |
| With the |
| The |
| The |
| The |
| The final option you can use is the |
If you entered this code in your editor and looked at it in your browser you wouldn't really see anything yet. The reason is that we didn't specify a background color (using the fill attribute) for the svg or g element, so the default background color is used. We can, however, check what has happened. We mentioned that besides a good editor to create code, we'll also do a lot of debugging inside the browser, and Chrome has some of the best support. If you open the previous code in your browser, you can already see what is happening when you inspect the elements:
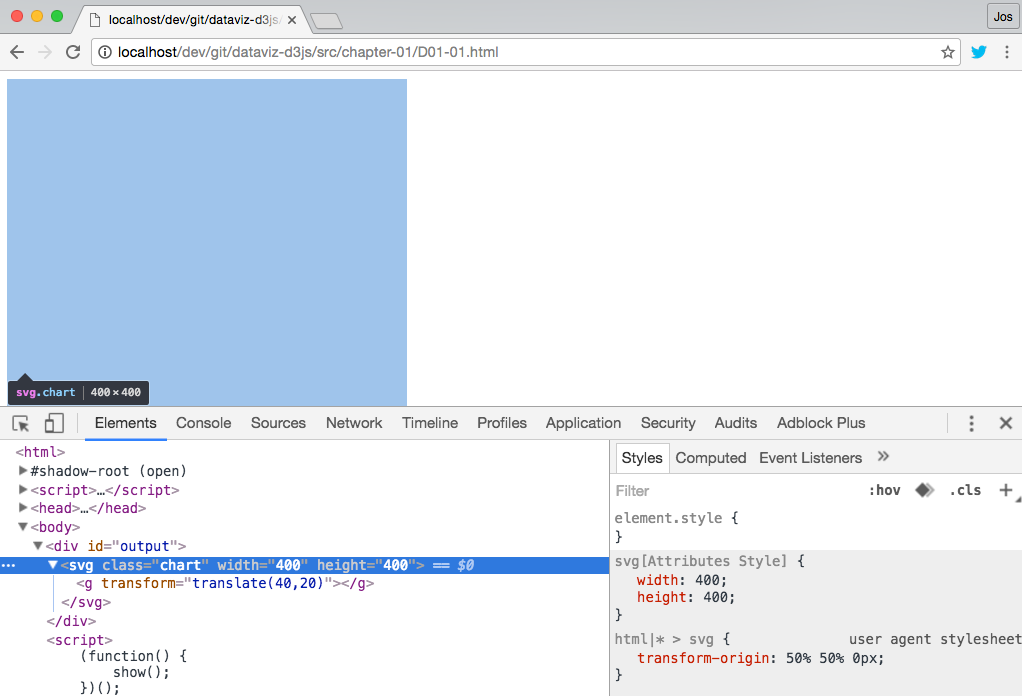
As you can see in this screenshot, the correct attributes have been set on the svg element, a g element is added, and the g element is transformed to position it correctly. If we want to style the svg element, we can use standard CSS for this. For instance, the following code (if added to the css file for this example) will set the background-color attribute of the svg element to black.
svg {
    background-color: black;
}
It is good to understand that CSS styles and element attributes have different priorities. Styles set using the style property have the highest priority, next the styles applied through the CSS classes, and the element properties set directly on the element have the lowest priority.
When we now open the example in the browser, you'll see the svg element as a black rectangle:
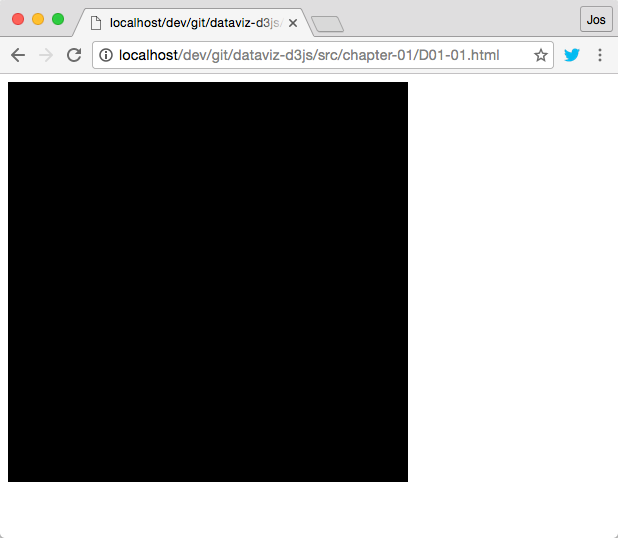
At this point, we've got an svg element with a specific size, and one g element to which we'll add other elements in the rest of this example.
Adding rectangles to the group element
In this step, we'll look at the core functionality of D3 which shows how to bind data to elements. We'll create an example that shows a number of rectangles based on some random data. We'll update the data every couple of seconds, and see how we can use D3 to respond to these changes. If you want to look at this example in action, open the example D01-01.html from the chapter 01 folder in your browser. The result looks something like this:
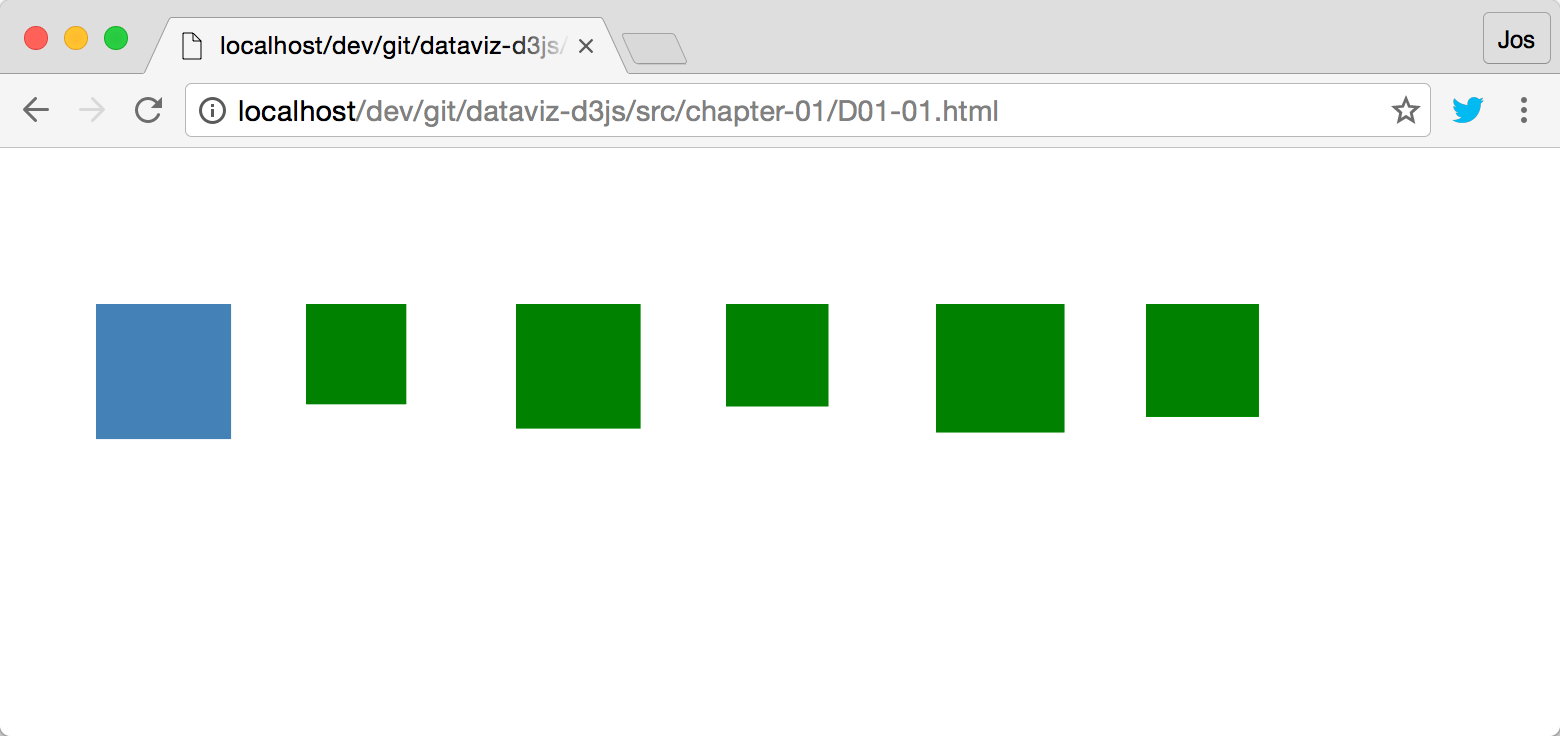
The size and number of rectangles in the screen is randomly determined and the colors indicate whether a rectangle is added or an existing one is updated. If the rectangle is blue, an existing rectangle was selected and updated; if a rectangle is green, it was added to the rectangles already available. It works something like this:
- The first time the rectangles are shown, no rectangles are on screen, so all the rectangles are newly added and colored green. So, for this example, assume we add three rectangles, which, since no rectangles are present, they rendered green.
- After a couple of seconds, the data is updated. Now assume five rectangles need to be rendered. For this, we'll update the three rectangles which are already there with the new data. These are rendered blue since we're updating them. And we add two new rectangles, which are rendered green, just like in the first step.
- After another couple of seconds, the data is updated again. This time we need to render four rectangles. This means updating the first four rectangles, which will turn them blue, and we'll remove the last one, since that one isn't needed anymore.
To accomplish this, we'll first show you the complete code and then step through the different parts:
function show() {
    'use strict';

    var margin = { top: 20, bottom: 20, right: 40, left: 40 },
        width = 800 - margin.left - margin.right,
        height = 400 - margin.top - margin.bottom;

    var chart = d3.select(".chart")
        .attr("width", width + margin.left + margin.right)
        .attr("height", height + margin.top + margin.bottom)
        .append("g")
        .attr("transform", "translate(" + margin.left + ","
                                        + margin.top + ")");

    function update() {

        var rectangleWidth = 100,
        data = [],
            numberOfRectangles = Math.ceil(Math.random() * 7);

        for (var i = 0 ; i < numberOfRectangles ; i++) {
            data.push((Math.random() * rectangleWidth / 2)
                                     + rectangleWidth / 2);
        }

        // Assign the data to the rectangles (should there be any)
        var rectangles = chart.selectAll("rect").data(data);

        // Set a style on the existing rectangles so we can see them
        rectangles.attr("class", "update")
            .attr("width", function(d) {return d})
            .attr("height", function(d) {return d});

        rectangles.enter()
            .append("rect")
            .attr("class", "enter")
            .attr("x", function(d, i) { return i * (rectangleWidth + 5) })
            .attr("y", 50)
            .attr("width", function(d) {return d})
            .attr("height", function(d) {return d});

        // Handle rectangles which are left over
        rectangles.exit().remove();

        // we could also change the ones to be remove
        // rectangles
        //     .exit()
        //     .attr("class", "remove");
    }

    // set initial value
    update();
    // and update every 3 seconds
    d3.interval(function() { update(); }, 3000);
}
In the beginning of this function, you once again see the code we use to create and set up our SVG and main g elements. Let's ignore that and move on to the update() function. When this function is called it will take a couple of steps:
Creating dummy data
The first thing it does is that it creates some dummy data. This is the data that determines how many rectangles to render, and how large the rectangles will be:
var rectangleWidth = 100,
    data = [],
    numberOfRectangles = Math.ceil(Math.random() * 7);

for (var i = 0 ; i < numberOfRectangles ; i++) {
    data.push((Math.random() * rectangleWidth / 2)
                             + rectangleWidth / 2);
}
This is just plain JavaScript, and this will result in the data array being filled with one to seven numeric values ranging from 50 to 100. It could look something like this:
[52.653238934888726, 88.52709144102309, 81.70794256804369, 58.10611357491862]
Binding the data and updating existing rectangles
The next step is assigning this data to a D3 selection. We do this by using the selectAll function on the chart variable we defined earlier (remember this is the main g element, we added initially):
var rectangles = chart.selectAll("rect").data(data);This call will select all the rectangles which are already appended as children to the chart variable. The first time this is called, rectangles will have no children, but on subsequent calls this will select any rectangles that have been added in the previous call to the update() function. To differentiate between newly added rectangles and rectangles which we'll reuse, we add a specific CSS class. Besides just adding the CSS class, we also need to make sure they have the correct width and height properties set, since the bound data has changed.
In the case of rectangles which we reuse, we do that like this:
rectangles.attr("class", "update")
          .attr("width", function(d) {return d})
          .attr("height", function(d) {return d});
To set the CSS we use the attr function to set the class property, which points to a style defined in our CSS file. The width and height properties are set in the same manner, but their value is based on the value of the passed data. You can do this by setting the value of that attribute to a function(d) {...}. The d which is passed in to this function is the value of the corresponding element from the bound data array. So the first rectangle which is found is bound to data[0], the second to data[1], and so on. In this case, we set both the width and the height of the rectangle to the same value.
The CSS for this class is very simple, and just makes sure that the newly added rectangles are filled with a nice blue color:
.update {
    fill: steelblue;
}
Adding new rectangles if needed
At this point, we've only updated the style and dimensions of the rectangles which are updated. We repeat pretty much the same process for the rectangles that need to be created. This happens when our data array is larger than the number of rectangles we can find:
rectangles.enter()
    .append("rect")
    .attr("class", "enter")
    .attr("x", function(d, i) { return i * (rectangleWidth + 5) })
    .attr("y", 50)
    .attr("width", function(d) {return d})
    .attr("height", function(d) {return d});
Not that different from the update call, but this time we first call the enter() function and then create the SVG element we want to add like this: .append("rect"). After the append call, we configure the rectangle and set its class, width, and height properties, just like we did in the previous section (this time the CSS will render the newly added rectangle in green). If you look at the code, you can see that we also set the position of this element by setting the x and y attributes of the added rectangle. This is needed since this is the first time this rectangle is added, and we need to determine where to position it. We fix the y position to 50, but need to make the x position dependent on the position of the element from the data array to which it is bound. We once again bind the attribute to a function. This time we specify a function with two arguments: function(d, i) {...}. The first one is the element from the data array, and the second argument (i), is the position in the data array. So the first element has i = 0, the second i = 1, and so on. Now, when we add a new rectangle we calculate its x position by just multiplying its array position with the maximum rectangleWidth and add a couple of pixels margin. This way none of our rectangles will overlap.
If you look at the code for adding new elements, and updating existing ones, you might notice some duplicate code. In both instances, we use .attr to set the width and the height properties. If we'd wanted to, we could remove this duplication by using the .merge function. The code to set the new width and height for the new elements and the updated ones would then look like this:
rectangles.attr("class", "update");

rectangles.enter()
    .append("rect")
    .attr("class", "enter")
    .attr("x", function(d, i) { return i * (rectangleWidth + 5) })
    .attr("y", 50)
    .merge(rectangles)
    .attr("width", function(d) {return d})
    .attr("height", function(d) {return d});
This means that after merging the new and updated elements together, on that combined set, we use the .attr function to set the width and the height property. Personally, I'd like to keep these steps separate, since it is more clear what happens in each of the steps.
Removing elements which aren't needed anymore
The final step we need to take is to remove rectangles that aren't needed anymore. If in the first call to update we add five rectangles, and in the next call only three are needed, we're stuck with two leftover ones. D3 also has an elegant mechanism to deal with that:
rectangles.exit().remove();
The call to exit() will select the elements for which no data is available. We can then do anything we want with those rectangles. In this case, we just remove them by calling remove(), but we could also change their opacity to make them look transparent, or animate them to slowly disappear.
For instance, if we replace the previous line of code with this:
rectangles.exit().attr("class", "remove");Then set the CSS for the remove class to this:
.remove {
    fill: red;
    opacity: 0.2;
}
In that case, we'd see the following:
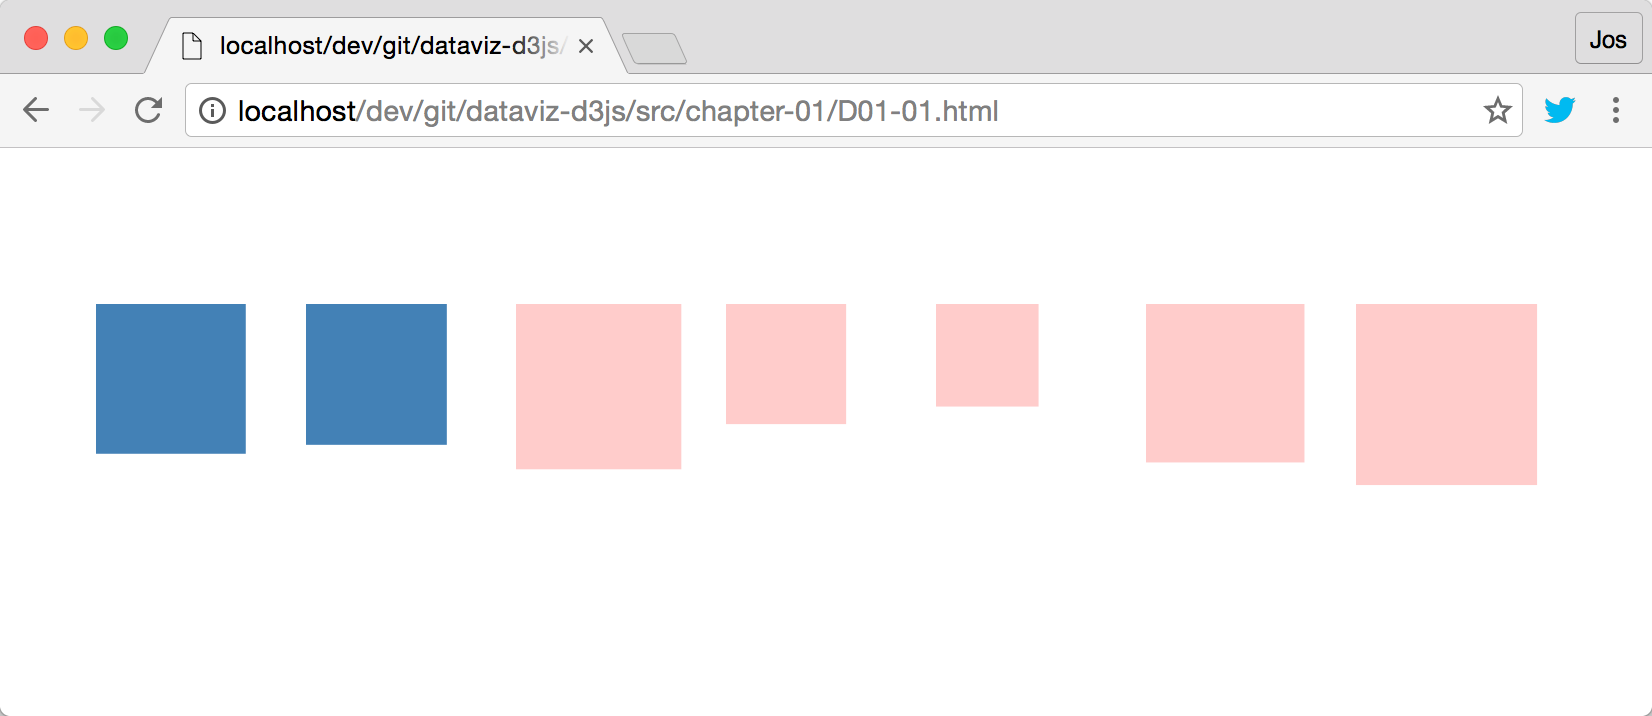
In the preceding screenshot, we've reused two existing rectangles, and instead of removing the five we don't need, we change their style to the remove class, which renders them semi-transparent red.


