
Screens
The graphs and maps we are familiar with cannot be combined into a single page on their own—for that, we may use an entity called a screen.
Let's create one together:
- Navigate to
Monitoring|Screens, and click on theCreate screenbutton. - Enter
Local serversin theNamefield and2in theColumnsfield. We will be able to add more later, if needed:
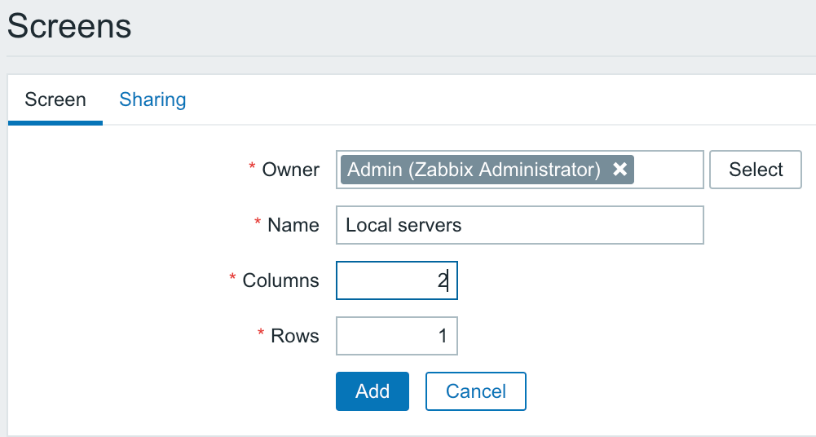
Note
As with network maps, screens may also be created and shared by users.
- Click on
Add, and then click onConstructornext toLocal servers. We are presented with a fairly unimpressive view:
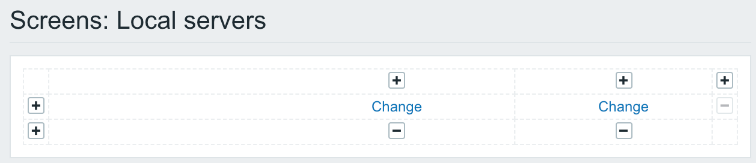
So, it's up to us to spice it up.
- Click on the left-hand
Changelink, and we have an editing form replacing the previous cell's contents. The default resource type is graph, and we created some graphs earlier. - Click on
Selectnext to theGraphfield. In the upcoming window, make sureA test hostis selected in theHostdrop-down, and then click onCPU load & traffic. - That's all we want to configure here for now, so click on
Add. - Now, click on the right...