Search icon CANCEL
Subscription
0
Cart icon
Your Cart (0 item)
Close icon
You have no products in your basket yet
Save more on your purchases! discount-offer-chevron-icon
Savings automatically calculated. No voucher code required.
Arrow left icon
All Products
Best Sellers
New Releases
Books
Videos
Audiobooks
Learning Hub
Newsletter Hub
Free Learning
Arrow right icon
timer SALE ENDS IN
0 Days
:
00 Hours
:
00 Minutes
:
00 Seconds
Arrow up icon
GO TO TOP
Tableau 10 Business Intelligence Cookbook

You're reading from   Tableau 10 Business Intelligence Cookbook Create powerful, effective visualizations with Tableau 10

Arrow left icon
Product type Paperback
Published in Nov 2016
Publisher Packt
ISBN-13 9781786465634
Length 476 pages
Edition 1st Edition
Tools
Arrow right icon
Authors (2):
Arrow left icon
Donabel Santos Donabel Santos
Author Profile Icon Donabel Santos
Donabel Santos
Paul Banoub Paul Banoub
Author Profile Icon Paul Banoub
Paul Banoub
Arrow right icon
View More author details
Toc

Table of Contents (17) Chapters Close

Tableau 10 Business Intelligence Cookbook
Credits
About the Author
Acknowledgements
About the Reviewer
www.PacktPub.com
Preface
1. Basic Charts 2. Advanced Charts FREE CHAPTER 3. Interactivity 4. Dashboards and Story Points 5. Maps and Geospatial Visualization 6. Analytics 7. Data Preparation Calculated Fields Primer Resources Index

Creating story points


Story Points allow us to organize our topics and views into a sequence of points that aid in presenting data. Story Points can leverage any views or dashboards in the workbook and use any of those in each point.

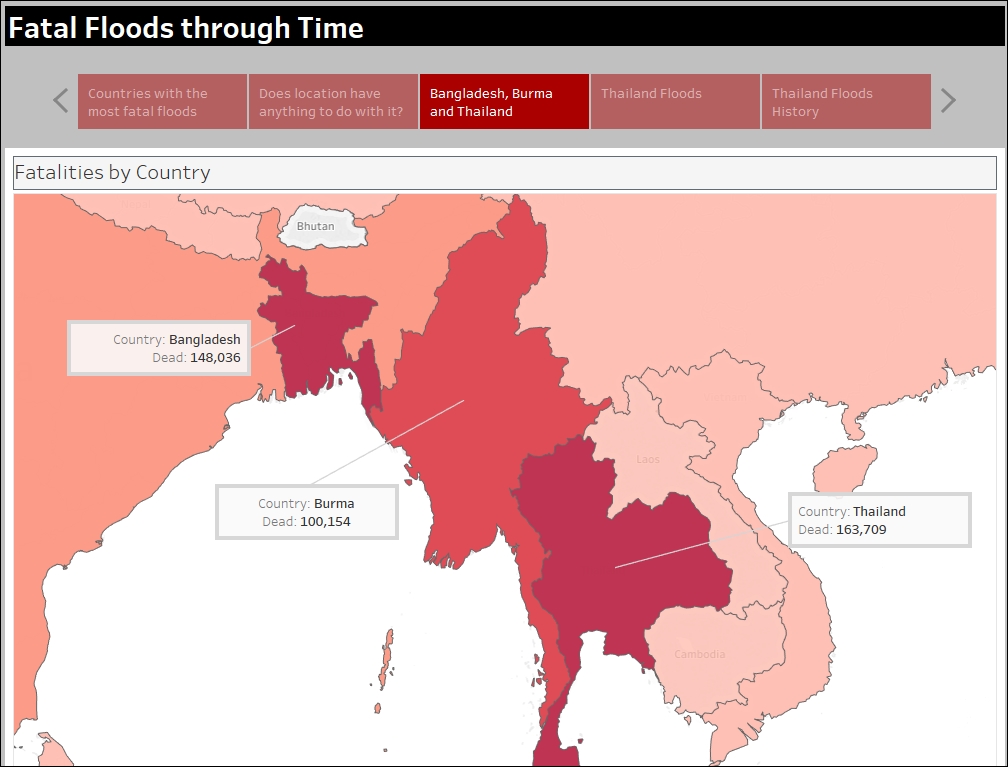
In this recipe, we will explore where fatal floods have happened over time using Tableau's story points.

Getting ready

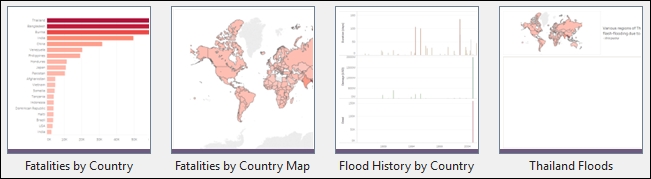
To follow this recipe, open B05527_04 – STARTER.twbx. We will use the following worksheets:

  • Fatalities by Country

  • Fatalities by Country Map

  • Flood History by Country

    We are also going to use the following dashboard which shows Thailand Floods data:

How to do it...

The following are the steps to create the story points in this recipe:

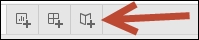
  1. Create a new story point. You can click on the new Story Point tab, which looks like a book with a plus sign, at the bottom of the canvas.

  2. Double-click on the title, and change story title to Fatal Floods over Time.

  3. Click on the Story menu at the top, and select Format.

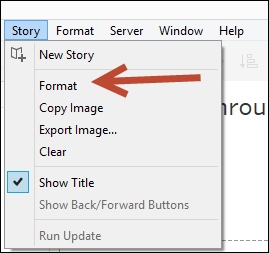
  4. Format the story using the following settings:

    • Story Shading...

lock icon The rest of the chapter is locked
Register for a free Packt account to unlock a world of extra content!
A free Packt account unlocks extra newsletters, articles, discounted offers, and much more. Start advancing your knowledge today.
Unlock this book and the full library FREE for 7 days
Get unlimited access to 7000+ expert-authored eBooks and videos courses covering every tech area you can think of
Renews at $15.99/month. Cancel anytime
Visually different images