Search icon CANCEL
Subscription
0
Cart icon
Your Cart (0 item)
Close icon
You have no products in your basket yet
Save more on your purchases! discount-offer-chevron-icon
Savings automatically calculated. No voucher code required.
Arrow left icon
All Products
Best Sellers
New Releases
Books
Videos
Audiobooks
Learning Hub
Newsletter Hub
Free Learning
Arrow right icon
timer SALE ENDS IN
0 Days
:
00 Hours
:
00 Minutes
:
00 Seconds
Arrow up icon
GO TO TOP
Tableau 10 Business Intelligence Cookbook

You're reading from   Tableau 10 Business Intelligence Cookbook Create powerful, effective visualizations with Tableau 10

Arrow left icon
Product type Paperback
Published in Nov 2016
Publisher Packt
ISBN-13 9781786465634
Length 476 pages
Edition 1st Edition
Tools
Arrow right icon
Authors (2):
Arrow left icon
Donabel Santos Donabel Santos
Author Profile Icon Donabel Santos
Donabel Santos
Paul Banoub Paul Banoub
Author Profile Icon Paul Banoub
Paul Banoub
Arrow right icon
View More author details
Toc

Table of Contents (17) Chapters Close

Tableau 10 Business Intelligence Cookbook
Credits
About the Author
Acknowledgements
About the Reviewer
www.PacktPub.com
Preface
1. Basic Charts 2. Advanced Charts FREE CHAPTER 3. Interactivity 4. Dashboards and Story Points 5. Maps and Geospatial Visualization 6. Analytics 7. Data Preparation Calculated Fields Primer Resources Index

Creating a unit chart


Unit charts, also referred to as pictogram charts, display each unit of measure as a single mark or symbol. While other types of charts may be more effective and less cluttered, unit charts may create more engagement because of the images and visuals used.

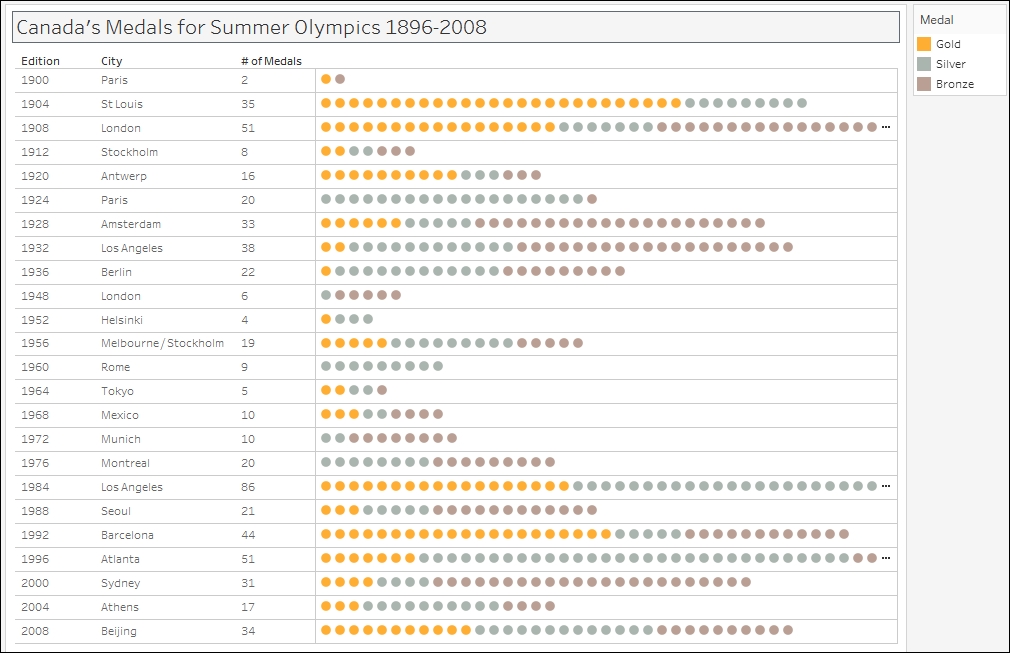
In this recipe, we will create a unit chart that shows all the medals that were won by Canada in the Summer Olympics from 1896-2008.

Getting ready

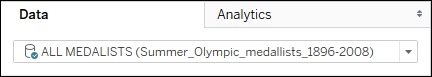
To follow this recipe, open B05527_02 – STARTER.twbx. Use the worksheet called Unit Chart, and connect to the ALL MEDALISTS (Summer_Olympic_medallists_1896-2008) data source.

How to do it...

The following are the steps to create a unit chart:

  1. From Dimensions, drag NOC to the Filters shelf and filter to CAN.

  2. From Dimensions, drag Edition to Rows.

  3. From Dimensions, drag City to Rows, to the right of Edition.

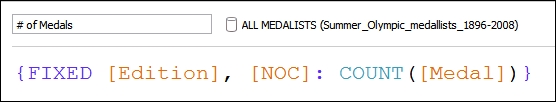
  4. Create a calculated field called # of Medals. This field should be fixed to Edition and NOC so that it is not affected by the data fields (pills) used in the view.

  5. From Dimensions...

You have been reading a chapter from
Tableau 10 Business Intelligence Cookbook
Published in: Nov 2016
Publisher: Packt
ISBN-13: 9781786465634
Register for a free Packt account to unlock a world of extra content!
A free Packt account unlocks extra newsletters, articles, discounted offers, and much more. Start advancing your knowledge today.
Unlock this book and the full library FREE for 7 days
Get unlimited access to 7000+ expert-authored eBooks and videos courses covering every tech area you can think of
Renews at $15.99/month. Cancel anytime
Visually different images