
Indexing files and directories
File- and directory-based inputs are the most commonly used ways of getting data into Splunk. The primary need for these types of input will be to index logfiles. Almost every application or system produces a logfile, and it is generally full of data that you want to be able to search and report on.
Splunk can continuously monitor for new data being written to existing files or new files being added to a directory, and it is able to index this data in real time. Depending on the type of application that creates the logfiles, you would set up Splunk to either monitor an individual file based on its location, or scan an entire directory and monitor all the files that exist within it. The latter configuration is more commonly used when the logfiles being produced have unique filenames, such as filenames containing a timestamp.
This recipe will show you how to configure Splunk to continuously monitor and index the contents of a rolling logfile located on the Splunk server. The recipe specifically shows how to monitor and index a Red Hat Linux system's messages logfile (/var/log/messages). However, the same principle can be applied to a logfile on a Windows system, and a sample file is provided. Do not attempt to index the Windows event logs this way, as Splunk has specific Windows event inputs for this.
Getting ready
To step through this recipe, you will need a running Splunk Enterprise server and access to read the /var/log/messages file on Linux. No other prerequisites are required. If you are not using Linux and/or do not have access to the /var/log/messages location on your Splunk server, use the cp01_messages.log file that is provided and upload it to an accessible directory on your Splunk server.
Note
You can download the example code files for all Packt books you have purchased from your account at http://www.packtpub.com. If you purchased this book elsewhere, you can visit http://www.packtpub.com/support and register to have the files emailed directly to you.
How to do it...
Follow these steps to monitor and index the contents of a file:
- Log in to your Splunk server.
- From the menu in the top right-hand corner, click on the
Settingsmenu and then click on theAdd Datalink: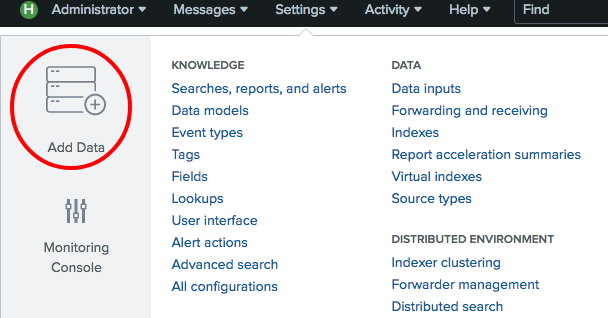
- If you are prompted to take a quick tour, click on
Skip. - In the
How do you want to add datasection, click onmonitor: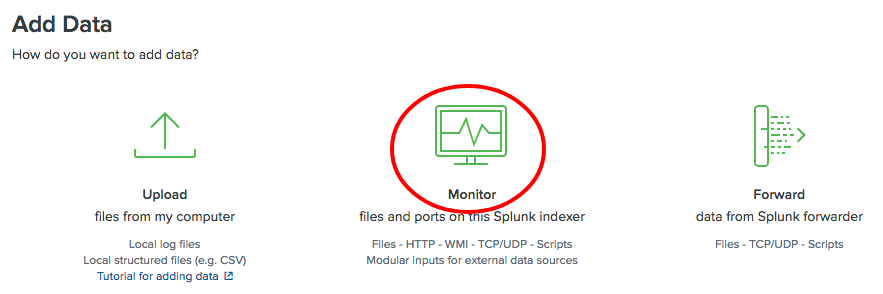
- Click on the
Files & Directoriessection: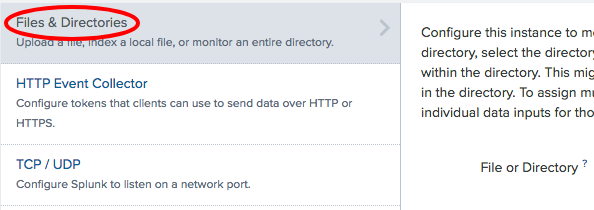
- In the
File or Directorysection, enter the path to the logfile (/var/log/messagesor the location of thecp01_messages.logfile), ensureContinuously Monitoris selected, and click onNext: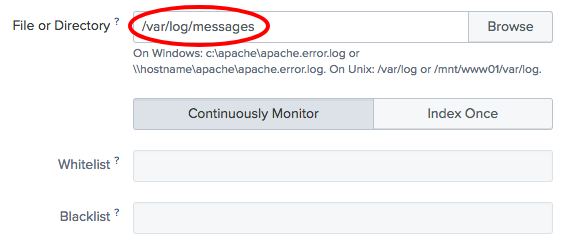
Note
If you are just looking to do a one-time upload of a file, you can select Index Once instead. This can be useful to index a set of data that you would like to put into Splunk, either to backfill some missing or incomplete data or just to take advantage of its searching and reporting tools.
- If you are using the provided file or the native
/var/log/messagesfile, the data preview will show the correct line breaking of events and timestamp recognition. Click on theNextbutton.
- A
Save Source Typebox will pop up. Enterlinux_messagesas theNameand then click onSave: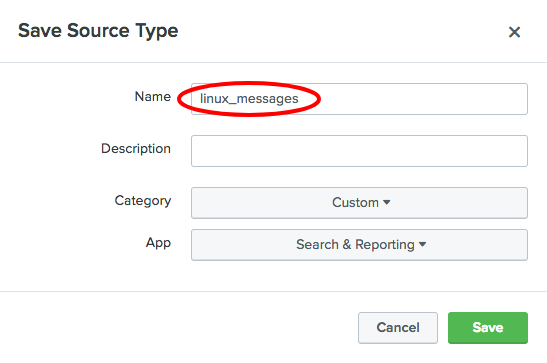
- On the
Input Settingspage, leave all the default settings and clickReview. - Review the settings and if everything is correct, click
Submit. - If everything was successful, you should see a
File input has been created successfullymessage:
- Click on the
Startsearching button. TheSearch & Reportingapp will open with the search already populated based on the settings supplied earlier in the recipe.
Note
In this recipe, we could have simply used the common syslog source type or let Splunk choose a source type name for us; however, starting a new source type is often a better choice. The syslog format can look completely different depending on the data source. As knowledge objects, such as field extractions, are built on top of source types, using a single syslog source type for everything can make it challenging to search for the data you need.
How it works...
When you add a new file or directory data input, you are basically adding a new configuration stanza into an inputs.conf file behind the scenes. The Splunk server can contain one or more inputs.conf files, and these files are either located in $SPLUNK_HOME/etc/system/local or in the local directory of a Splunk app.
Splunk uses the monitor input type and is set to point to either a file or a directory. If you set the monitor to a directory, all the files within that directory will be monitored. When Splunk monitors files, it initially starts by indexing all the data that it can read from the beginning. Once complete, Splunk maintains a record of where it last read the data from, and if any new data comes into the file, it reads this data and advances the record. The process is nearly identical to using the tail command in Unix-based operating systems. If you are monitoring a directory, Splunk also provides many additional configuration options, such as blacklisting files you don't want Splunk to index.
Note
For more information on Splunk's configuration files, visit https://docs.splunk.com/Documentation/Splunk/latest/Admin/Aboutconfigurationfiles.
There's more...
While adding inputs to monitor files and directories can be done through the web interface of Splunk, as outlined in this recipe, there are other approaches to add multiple inputs quickly. These allow for customization of the many configuration options that Splunk provides.
Adding a file or directory data input using the CLI
Instead of using the GUI, you can add a file or directory input through the Splunk command-line interface (CLI). Navigate to your $SPLUNK_HOME/bin directory and execute the following command (replacing the file or directory to be monitored with your own):
For Unix, we will be using the following code to add a file or directory input:
./splunk add monitor /var/log/messages -sourcetype linux_messagesFor Windows, we will be using the following code to add a file or directory input:
splunk add monitor c:/filelocation/cp01_messages.log -sourcetype linux_messagesThere are a number of different parameters that can be passed along with the file location to monitor.
Note
See the Splunk documentation for more on data inputs using the CLI (https://docs.splunk.com/Documentation/Splunk/latest/Data/MonitorfilesanddirectoriesusingtheCLI).
Adding a file or directory input using inputs.conf
Another common method of adding the file and directory inputs is to manually add them to the inputs.conf configuration file directly. This approach is often used for large environments or when configuring Splunk forwarders to monitor for files or directories on endpoints.
Edit $SPLUNK_HOME/etc/system/local/inputs.conf and add your input. After your inputs are added, Splunk will need to be restarted to recognize these changes.
For Unix, we will use the following code:
[monitor:///var/log/messages]sourcetype = linux_messages
For Windows, we will use the following code:
[monitor://c:/filelocation/cp01_messages.log]sourcetype = linux_messages
Note
Editing inputs.conf directly is often a much faster way of adding new files or directories to monitor when several inputs are needed. When editing inputs.conf, ensure that the correct syntax is used and remember that Splunk will need a restart for modifications to take effect. Additionally, specifying the source type in the inputs.conf file is the best methods for assigning source types.
One-time indexing of data files using the Splunk CLI
Although you can select Upload and Index a file from the Splunk GUI to upload and index a file, there are a couple of CLI functions that can be used to perform one-time bulk loads of data.
Use the oneshot command to tell Splunk where the file is located and which parameters to use, such as the source type:
./splunk add oneshot XXXXXXXAnother way is to place the file you wish to index into the Splunk spool directory, $SPLUNK_HOME/var/spool/splunk, and then add the file using the spool command, as shown in the following code:
./splunk spool XXXXXXXNote
If using Windows, omit the dot and slash (./) that is in front of the Splunk commands mentioned earlier.
Indexing the Windows event logs
Splunk comes with special inputs.conf configurations for some source types, including monitoring Windows event logs. Typically, the Splunk Universal Forwarder (UF) would be installed on a Windows server and configured to forward the Windows events to the Splunk indexer(s). The configurations for inputs.conf to monitor the Windows security, application, and event logs in real time are as follows:
[WinEventLog://Application]
disabled = 0
[WinEventLog://Security]
disabled = 0
[WinEventLog://System]
disabled = 0
By default, the event data will go into the main index, unless another index is specified.
See also
- The Getting data through network ports recipe
- The Using scripted inputs recipe
- The Using modular inputs recipe