Search icon CANCEL
Subscription
0
Cart icon
Your Cart (0 item)
Close icon
You have no products in your basket yet
Save more on your purchases! discount-offer-chevron-icon
Savings automatically calculated. No voucher code required.
Arrow left icon
All Products
Best Sellers
New Releases
Books
Videos
Audiobooks
Learning Hub
Newsletter Hub
Free Learning
Arrow right icon
timer SALE ENDS IN
0 Days
:
00 Hours
:
00 Minutes
:
00 Seconds
Arrow up icon
GO TO TOP
QGIS 2 Cookbook

You're reading from   QGIS 2 Cookbook Become a QGIS power user and master QGIS data management, visualization, and spatial analysis techniques

Arrow left icon
Product type Paperback
Published in Apr 2016
Publisher
ISBN-13 9781783984961
Length 390 pages
Edition 1st Edition
Tools
Arrow right icon
Authors (3):
Arrow left icon
 Mandel Mandel
Author Profile Icon Mandel
Mandel
 Olaya Ferrero Olaya Ferrero
Author Profile Icon Olaya Ferrero
Olaya Ferrero
Anita Graser Anita Graser
Author Profile Icon Anita Graser
Anita Graser
Arrow right icon
View More author details
Toc

Table of Contents (19) Chapters Close

QGIS 2 Cookbook
Credits
About the Authors
About the Reviewers
www.PacktPub.com
Preface
1. Data Input and Output FREE CHAPTER 2. Data Management 3. Common Data Preprocessing Steps 4. Data Exploration 5. Classic Vector Analysis 6. Network Analysis 7. Raster Analysis I 8. Raster Analysis II 9. QGIS and the Web 10. Cartography Tips 11. Extending QGIS 12. Up and Coming Index

Automating analysis tasks using the graphical modeler


Most analysis tasks involve using several algorithms. Repeating the same analysis with a different dataset or different input parameters requires using them one by one, making this task tedious and error-prone. You can automate analysis workflows using the Processing graphical modeler, which allows you to define a workflow graphically and wrap it in a single algorithm. This recipe introduces the main ideas about the modeler and creates a simple model as an example.

Getting ready

No special preparation is needed in QGIS for this recipe, but make sure that you have read the previous recipe about computing a topographic index. This recipe will create a model based on the workflow in that recipe, so it is important that you understand it.

How to do it…

  1. Open the graphical modeler by navigating to Processing | Graphical modeler:

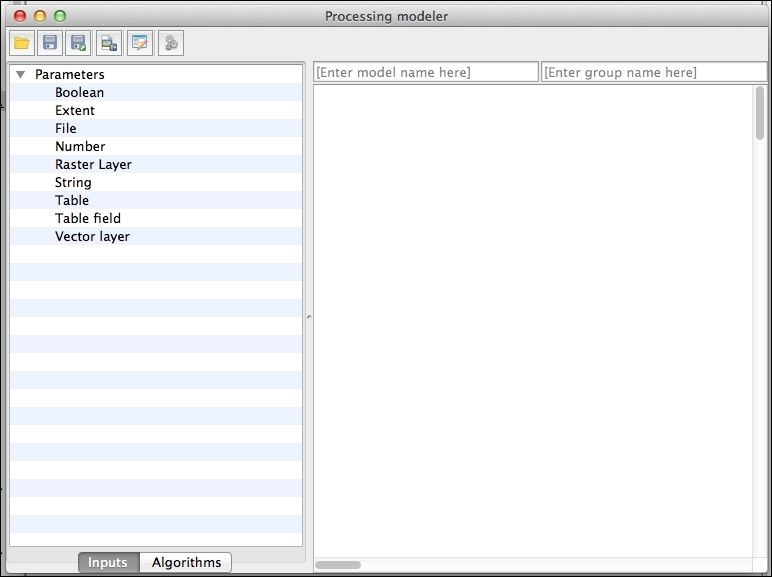
  2. Double-click on the Raster Layer item to add a raster input. In the dialog that will appear to define the input, name...

lock icon The rest of the chapter is locked
Register for a free Packt account to unlock a world of extra content!
A free Packt account unlocks extra newsletters, articles, discounted offers, and much more. Start advancing your knowledge today.
Unlock this book and the full library FREE for 7 days
Get unlimited access to 7000+ expert-authored eBooks and videos courses covering every tech area you can think of
Renews at $15.99/month. Cancel anytime
Visually different images