Using debugger functions
With PowerShell version 5, great functions such as debugging scripts and code in PowerShell were added. This was introduced in Windows Management Framework (WMF) 5.0. In this recipe, we will take a look at it in more depth. This recipe is more a general PowerShell function but can of course be applied to Exchange scripts.
Let us take a look at two of these functions in detail and start with the basics and then advance from there. Both these examples can be used in the PowerShell console and in Windows PowerShell ISE.
The first method we are going to take a look at is called Break All, introduced in PowerShell v5. This method gives us the option to debug the PowerShell workflow and supports command and tab completion. We can debug nested workflow functions both in local and remote sessions.
The second function in this recipe will be to use the Debug-Job cmdlet inside more complex and advanced scripts. It uses the same basis as the Break All function.
How to do it...
First we create a variable named $i with a value of 1 and then create a loop using the Do While operator. The loop will run until $i is less or equal to 20. Within the loop a text string is written to the console with a text Value: and the value of $i.
$i = 1
Do {
Write-Host "Value: $i"
   $i++
   Start-Sleep -Milliseconds 200
}
While ($i -le 20)
As this is a basic example on how the debugger can be used, this method would be helpful for production when executing scripts. The debugger mode can be used when the script is running by pressing Ctrl + Break or Ctrl + B. When breaking the script, it will look like the following screenshot:
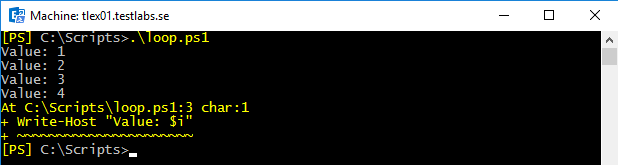
We can see that the script called loop.ps1 is stopped and has entered debug mode. When pressing h or ?, the help information will show up.
In debug mode, we can see the full source code (using l) in the current script; we can also step through every row in the script (using s), step to the next statement (using v), and, of course, continue running the script (using c) or stop the operation and exit debug mode (using q).
How it works...
By initializing the debugging mode, the script is stopped until using either the Continue or Quit commands. The debugging can be very helpful; for example, you can step through the code, view source code, verify variables, view the environment state, and execute commands.
As an example, from the preceding screenshot, let us take a look at what the value in the variable $i is by typing the following:
[PS] C:\Scripts>$i4
Here we see that the value was 4 as the loop was stopped at that stage.
Note
One thing to mention is that the script debugging method will only debug the executed script itself and cannot collect any information from external native commands or scripts and send back the result into the debugging mode. For more advanced debugging, use managed code together with Visual Studio, Visual Studio Code, or WinDbg.
There's more...
Together with the code debugger function, we can use the Debug-Job cmdlet that was introduced in version 5 of PowerShell.
The Debug-Job cmdlet lets you break into the script debugger while running a job in a similar way as the Break All function lets us break into running script from the console or ISE.
A typical scenario where we could use Debug-Job is when we are running a long, complex script as a job and, for one reason or another, we suspect the script is not executing correctly. It may be taking longer than expected or some of the output data doesn't seem right. Now we can drop the job into the debugger by using the Debug-Job which allows us to verify that the code is being executed the way it's expected to do. It's a great and helpful function.
As you probably are aware of, or will face in the future, is that while debugging scripts, interactively they work as expected, but when they are running as jobs in production they fail. However, this can now be debugged with this new feature by setting breakpoints or using the Wait-Debugger cmdlet.
In the following example, we are setting a breakpoint at line 4 to debug the script and run it as a job and use the Debug-Job cmdlet:
$job = Start-Job -ScriptBlock { Set-PSBreakpoint ` C:\Scripts\MyJob.ps1-Line 4; C:\Scripts\MyJob.ps1 `} $jobDebug-Job $job
By doing this, we will enter debugging mode and can reach variables, execute commands, view the environment state, view source code, and step through the code.
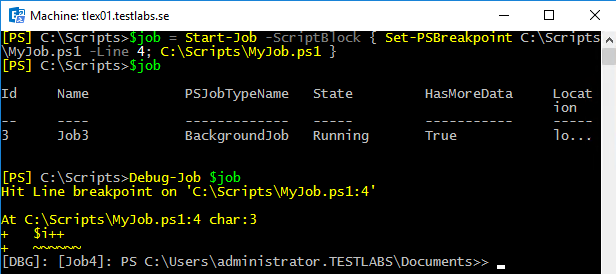
The preceding screenshot shows that the job state is AtBreakpoint, which means that it is waiting to be debugged. The method works similarly to the Break All method; it will only debug the script itself and cannot debug any external commands.
To continue the process and leave debugging mode, use the detach command.
See also
- The Understanding the new execution Policy recipe in this chapter
- The Creating custom objects recipe in this chapter
- The Using the Save-Help function recipe in this chapter