Using the Data Tips while debugging
During code debugging, Data Tips are used to provide more information of an object/variable in the current scope of execution and work only in break mode. They use the data type information to display each value that has a type associated with it. The debugger loads the object information recursively in a hierarchical structure and displays it in the editor.
Here's an example of how the Data Tips load for an object:
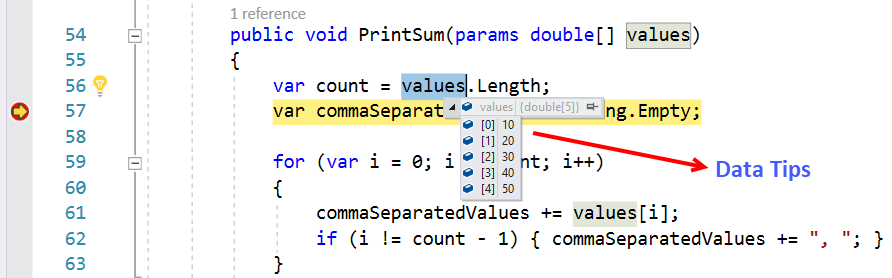
To display a Data Tip, place a breakpoint in your application code and run it in debug mode. When the breakpoint hits, hover over an object/variable to display the Data Tip associated with that object/variable. It is a tree of members which you can expand to get more details associated with it. When you hover out of the object/variable, the Data Tips disappear.
Note
The Data Tips are evaluated in the current execution context where the breakpoint hits and the execution moved into suspended state. Thus, hovering over a variable in another function...